Collect logs for CAST Support
Overview
When you raise a case, CAST Support often asks for one or more logs. This page lists the names Support uses for each log, then explains how to retrieve it - from the CAST Imaging UI where possible, and from disk on Microsoft Windows and Linux via Docker/Podman where you have access to the servers.
Which log does Support mean?
Find the name Support used in the left column, then go to the section listed in the right column. Where the name is ambiguous, ask Support which one they mean.
| Name used by Support | What it is | How to get it |
|---|---|---|
| Analysis log, job log, application log, AIP log, CAST-MS log, Core log | The step-by-step log of a job run on an application: source code delivery, fast scan, analysis, snapshot, publication to the viewer | Analysis logs |
| A step name or step ID, for example “generate views (process_imaging) logs” | The log of one step of a job | Logs of a specific step |
| Debug log, analysis log in debug mode | An analysis log produced with debug messages turned on | Analysis logs in debug mode |
Node log, analysis-node log, analysis-node.log |
The service log of the analysis-node component, not the log of an analysis |
Service logs |
Console log, console service log, console.log, aip-gateway.log |
The log of the console service in imaging-services |
Service logs |
| Browser console, developer console, F12 log | Errors displayed by your web browser, not by CAST Imaging | Browser logs |
| HAR, HAR file, network trace | A recording of the requests your browser exchanged with CAST Imaging | Browser logs |
| Gateway log | The gateway service in imaging-services: every request to CAST Imaging goes through it |
Service logs |
| Auth log, auth-service log | The auth-service service in imaging-services |
Service logs |
| SSO log, Keycloak log | The sso service in imaging-services (Keycloak), which handles login, LDAP and SAML |
Service logs |
| Control Panel log, CP log, admin center log | The control-panel service in imaging-services, which registers the other services |
Service logs |
| Viewer log, server log, imaging-service log, access log | The server service in imaging-viewer, which serves the viewer UI |
Service logs |
ETL log, imaging-etl.log |
The etl service in imaging-viewer, which loads analysis results into Neo4j at the end of an analysis |
Service logs |
| API log, Imaging API log | The imaging_apis service in imaging-viewer |
Service logs |
| AI Service log, AI Manager log, agents log, GraphRAG log | The open_ai_manager service in imaging-viewer, which serves the AI features |
Service logs |
Neo4j log, neo4j.log, debug.log, query.log |
The graph database of imaging-viewer |
Service logs |
Dashboards log, restapi.log |
The dashboards component |
Service logs |
Container log, stdout, docker logs |
What a container writes to its standard output, on Linux only | Container logs |
| Install log, installer log, update log | The output of the installer or the update | Installation and update logs |
| PostgreSQL log | The PostgreSQL instance that holds the analysis schemas | Other logs |
| Extend proxy log, Extend local server log | CAST Extend local server | Other logs |
| MCP server log | CAST Imaging MCP Server or Gatekeeper MCP Server | Other logs |
| Application backup, delivery folder, schema backup | Not a log: a copy of the application’s delivery folder and analysis schemas, which Support uses to reproduce a problem | Delivery folder and schema backup |
LISA and LTSA are temporary analysis folders, not logs. Support may ask for their content to reproduce an issue - see Microsoft Windows file storage locations and Docker/Podman file storage locations.
Before you send logs
Include the following with the logs so Support can find the relevant lines:
- The CAST Imaging release, for example
3.6.9-funcrel. - The date, time and time zone at which the problem occurred, and the name of the application if one is involved.
- The name of the node that ran the job, in a deployment with several nodes.
Choose a date range that covers the problem. Logs contain the paths and names of your source files, and can contain host names and user names: review them against your own policy before you send them.
Deployments with several machines
In a distributed deployment, the CAST Imaging components are spread over several machines, for example imaging-services and dashboards on one machine, imaging-viewer on a second, and one or more analysis-node instances on others. Each component writes its logs on the machine where it runs, so a log you retrieve from disk is only on one of them.
The UI does not have this constraint: the application’s Logs page and the Logs tab of the Services settings page retrieve logs from every machine, so you can download everything from your browser without knowing where each component runs. Use them where you can.
When you retrieve logs from disk, use this table to find the machine:
| Logs | Machine that holds them |
|---|---|
Analysis logs, job-logs copy |
None in particular: job-logs is in the shared common-data folder, which every node and the imaging-services machine can read |
Analysis logs, Logs folder, including the logs of the tools such as CAST-MS |
The node that ran the job only. The Logs page shows the node of each job as <host>:<port> |
| Node log | Every node, one log each. Send the log of the node that ran the job, or the logs of all nodes when the problem is not tied to a job |
imaging-services logs: Control Panel, Gateway, Auth Service, Console, SSO |
The machine where imaging-services is installed |
imaging-viewer logs: Viewer, ETL, Imaging API, AI Service, Neo4j |
The machine where imaging-viewer is installed |
| Dashboards log | The machine where dashboards is installed |
| Container logs | The machine that runs the container |
| Installation and update logs | The machine on which the installer or the update was run |
- To see which machines make up your deployment, open the Services tab of the Services settings page: it lists each node with its host and port, and the URL of
imaging-vieweranddashboards. - The commands on this page that bundle logs from disk collect only the folders found on the machine they run on, and name the archive after that machine. Run them on each machine, then send all the archives.
- In a deployment with several nodes, a job can run on any of them: the node is chosen when the job starts. Do not assume that two jobs of the same application ran on the same node.
Analysis logs
Analysis logs record each step of a job run on an application: one log per step, plus the logs of the tools the step runs, such as CAST-MS, DMT or the profiler.
From the application’s Logs page
You need access to the application.
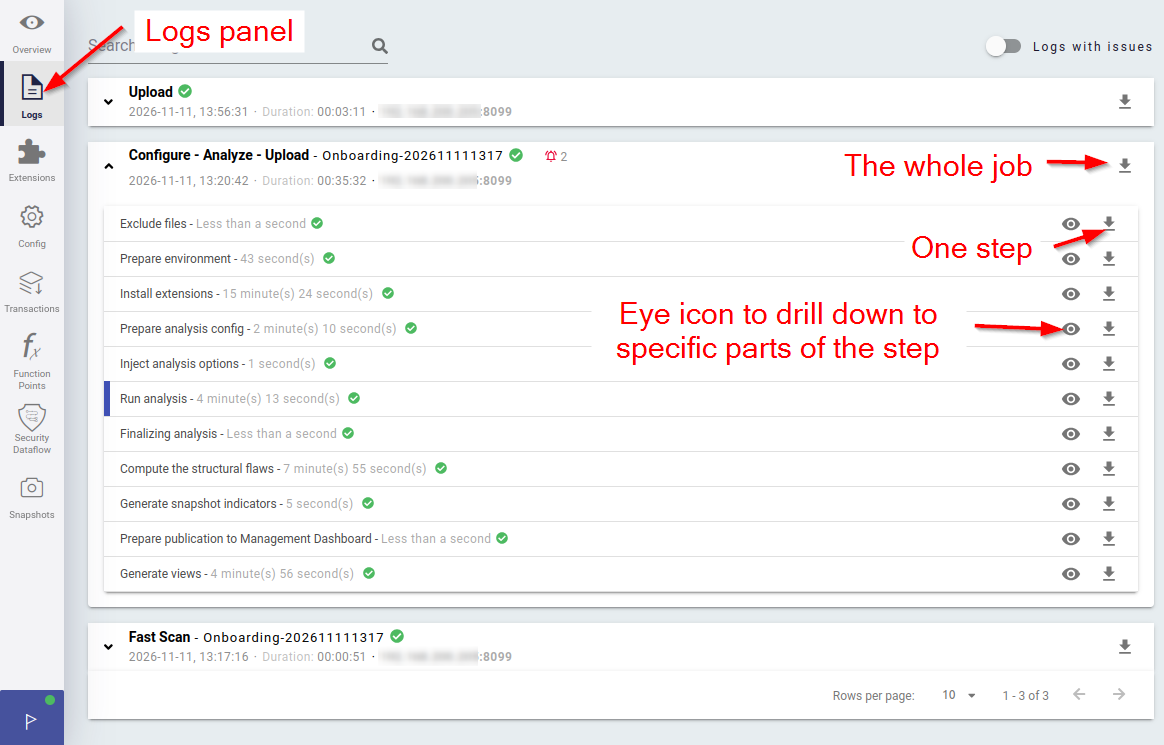
- Open the application, then select Logs in the left menu. The page lists the jobs run on the application, most recent first, each with its start time, duration and the node that ran it. See Logs page for a description of the page.
- Find the job in question. A deep analysis is listed as Configure - Analyze - Upload, a fast scan as Fast Scan, and the dashboards consolidation that follows a deep analysis as a separate job named Upload.
- Download what Support asked for:
- The whole job: select the download icon at the end of the job’s row. You receive one ZIP file, for example
20261111-132042_deep_analysis_logs.zip, with one folder per step named with the step ID. When in doubt, send this, or, if you are an administrator, the more complete download described in From the application details, for administrators. - One step: expand the job, then select the download icon at the end of the step’s row. Steps are listed with the names given in Logs of a specific step.
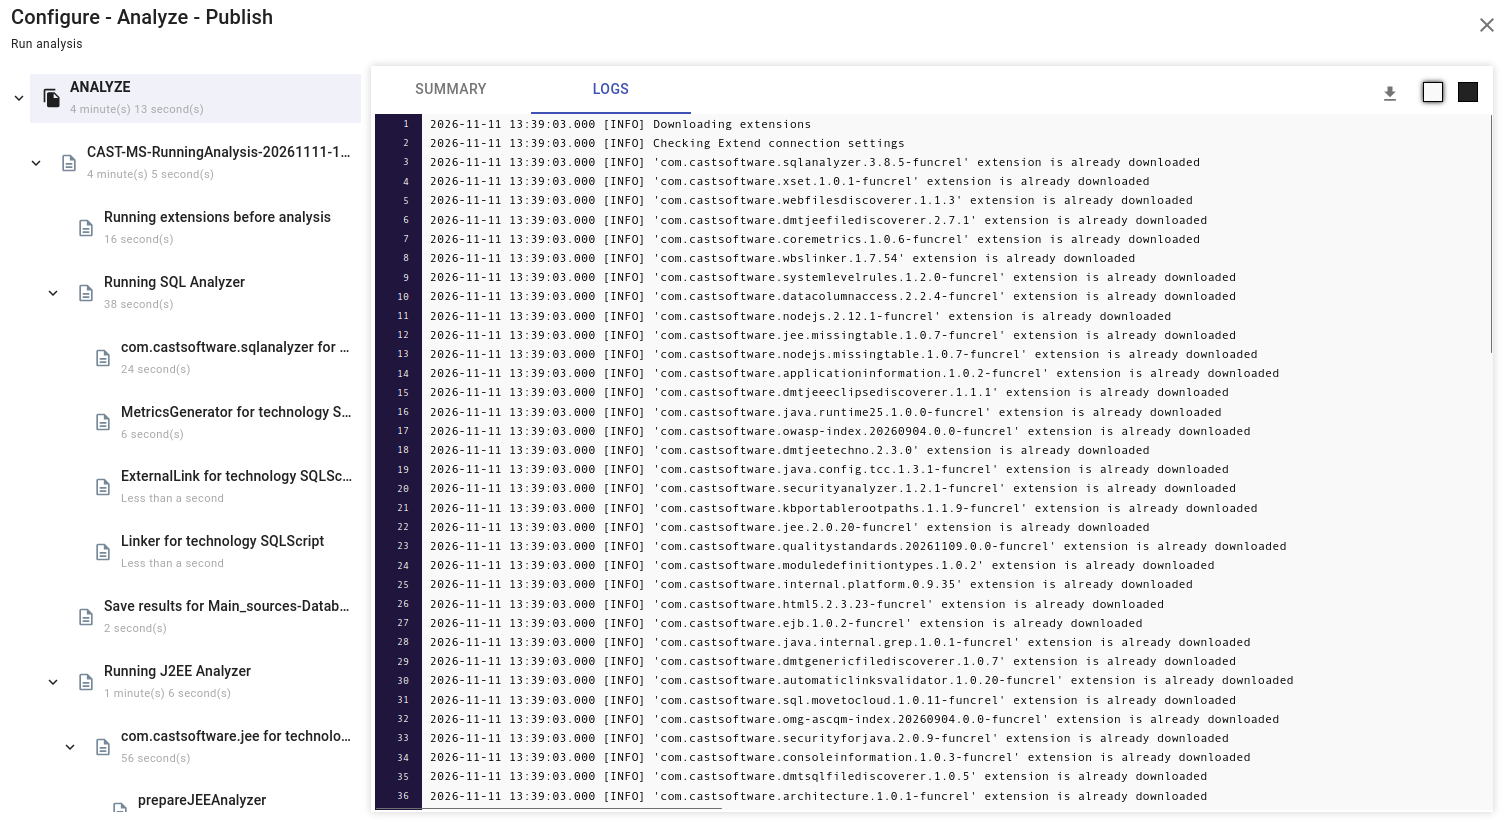
- One log of a step, for example the log of one analyzer: select the eye icon of the step to open it, select the log in the left panel, then select the download icon of the LOGS tab.
- The whole job: select the download icon at the end of the job’s row. You receive one ZIP file, for example
In this example, the deep analysis job is expanded to show its steps, with the dashboards consolidation (Upload) above it and the Fast Scan below:
The eye icon of a step opens it, with the logs of the tools it ran in the left panel. The download icon of the LOGS tab downloads the log selected on the left:
The Job Monitor uses the same job names as the Logs page, which helps you find the right job when several have run.
From the application details, for administrators
You need the Admin profile or a profile with the Administrator role. This download is the most complete record of a job, and does not require access to the application:
- Select the application in the list of applications, then open its details from the Actions menu - see Managing Application details.
- Expand the CAST Support section. It lists the jobs run on the application, most recent first, with the version, the node that ran each job, its status and its date.
- Select the download icon at the end of the job’s row.
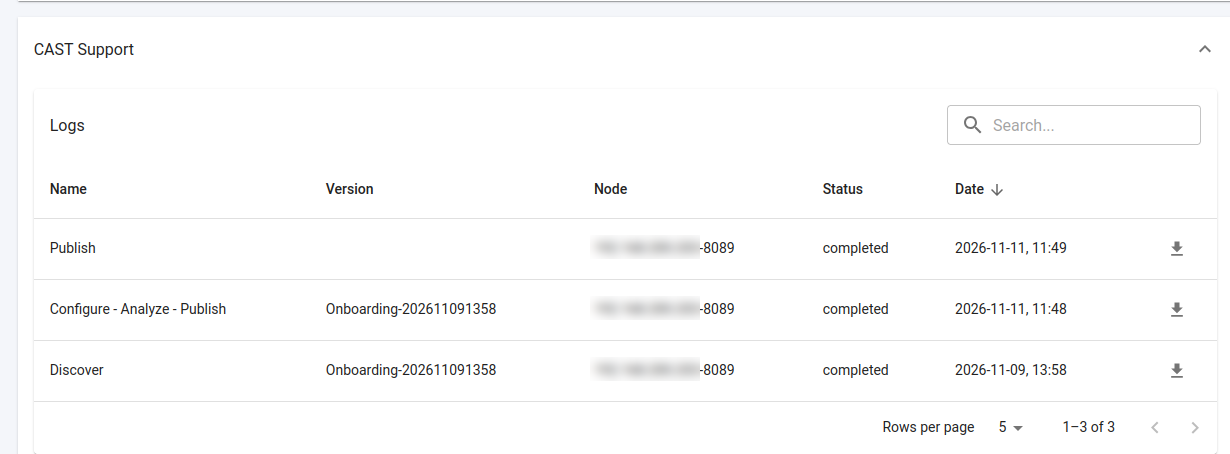
You receive one ZIP file named after the job and its start time: <date>-<time>_fast_scan_original_logs.zip, <date>-<time>_deep_analysis_original_logs.zip or <date>-<time>_run_measure_task_original_logs.zip. The Logs page download of the same job is named ..._logs.zip instead.
Both ZIP files have one folder per step, named with the step ID, and the same logs in each step folder. They differ in form:
| Logs page download | CAST Support download | |
|---|---|---|
| Log files | Converted to plain .log files, numbered in the order they ran, for example 18-jeeanalyzer.log |
The original files, with their original names and formats, for example Carl_MA_JEE.log or DMT-CreateVersionForServer-<date>.castlog2 |
castms-logs folder |
No | The working logs of CAST-MS, including the debug logs and the per-analyzer reports, for a deep analysis or an Upload job |
dmt-delivery folder |
No | The logs written in the delivery folder when the source code was packaged, for a deep analysis |
log-file-list.txt |
No | The full path on the server of every file in the ZIP |
The section names jobs differently from the Logs page:
| CAST Support section | Logs page |
|---|---|
| Discover | Fast Scan |
| Configure - Analyze - Publish | Configure - Analyze - Upload |
| Publish | Upload |
From disk
Each job has an ID, and its logs are stored in two places:
- In the
job-logsfolder of the sharedcommon-datafolder - one subfolder per job, then one subfolder per step, named with the step ID. This is the copy the Logs page displays, and the easiest one to send: compress the job’s folder. - In the
Logsfolder of the node that ran the job - one subfolder per application, holding one subfolder per job with one file per step, named0-<step>.log. The logs of the tools run by each step, such asCAST-MS-*.log,DMT-*.castlog2andprofiler-*.log, are at the application level.
| Location | Microsoft Windows | Linux via Docker/Podman |
|---|---|---|
job-logs |
<common-data>\job-logs\<job ID>\<step ID>\ |
/opt/cast/shared/common-data/job-logs/<job ID>/<step ID>/ |
Logs on the node |
%PROGRAMDATA%\CAST\CAST\Logs\<application>\<job ID>\ |
/opt/cast/core/CAST/Logs/<application>/<job ID>/ - inside the analysis-node container, /usr/share/CAST/CAST/Logs |
On Microsoft Windows, <common-data> is the folder set with SHARED_FOLDER when CAST Imaging was installed, by default c:\cast-node\common-data. To find it, run the following in PowerShell:
Select-String -Path "$env:ProgramData\CAST\CAST\.install\all-currenSettings.txt" -Pattern 'SHARED_FOLDER'
For example, a fast scan of the application JSP produced:
job-logs/29bfa847-810e-438d-a4c3-c8f7560109b8/
  code_scanner/
  create_delivery_folder/
  prepare_version/
  unzip_source/

Logs/JSP/
  29bfa847-810e-438d-a4c3-c8f7560109b8/
    0-code-scanner.log
    0-create-delivery-folder.log
    0-prepare-version.log
    0-unzip-source.log
  CAST-MS-createEmptyApplication-20261109-135802.log
  DMT-CreateVersionForServer-20261109-135816.castlog2
  profiler-20261109-135835.log
To find the ID of a job, use the most recent folder in job-logs, or search the node log for the date of the job: each job starts with a line such as Starting 'fast_scan' job execution '<job ID>'. In a deployment with several nodes, the job may have run on any of them, but job-logs is on the shared folder that all nodes use - see Deployments with several machines.
Logs of a specific step
Support often names the step whose log they need, using either the name shown on the Logs page or the step ID. The step ID is also the name of the step’s folder in job-logs, and the step’s main log is 0-<step ID with dashes>.log. For example, “generate views (process_imaging) logs” is the log of the Generate views step: download it from the Logs page, or send the folder job-logs/<job ID>/process_imaging/.
Each step also holds the logs of the tools it ran, numbered in the order they ran: CAST-MS, ServMan, DMT, the profiler, or one log per analyzer and extension for Run analysis. On disk, send the whole step folder, not only the 0- file.
Fast Scan job
| Shown on the Logs page | Step ID | What the step does |
|---|---|---|
| Create delivery folder | create_delivery_folder |
Creates the application |
| Unzipping source | unzip_source |
Extracts the uploaded source code |
| Initialize fast scan | prepare_version |
Creates the version |
| Content discovery | code_scanner |
Scans and classifies the source files |
Configure - Analyze - Upload job
The deep analysis:
| Shown on the Logs page | Step ID | What the step does |
|---|---|---|
| Exclude files | exclude_files |
Excludes the files selected for exclusion |
| Prepare environment | prepare_environment |
Creates the application schemas and imports preferences |
| Install extensions | install_extensions |
Installs the extensions in the application schemas |
| Prepare analysis config | prepare_analysis_config |
Packages, delivers and accepts the version |
| Inject analysis options | inject_analysis_options |
Applies the analysis settings |
| Run analysis | analyze |
Runs the analyzers and extensions |
| Finalizing analysis | restore_files |
Restores the files excluded before the analysis |
| Compute the structural flaws | snapshot |
Computes the snapshot |
| Generate snapshot indicators | snapshot_indicator |
Computes the snapshot indicators |
| Prepare publication to Management Dashboard | upload_application |
Sends the snapshot to the Measurement Service, which then starts the Upload job. When results are missing from the dashboards, send this step with the Upload job that followed it and the dashboards log |
| Generate views | process_imaging |
Sends the results to the etl service of imaging-viewer, which loads them into Neo4j for the viewer. The step log includes the ETL’s output for the import: when the cause is not there, also send the ETL and Neo4j logs for the same date range |
Upload job
The consolidation for the dashboards, started by the Prepare publication to Management Dashboard step of the deep analysis. Its job type is run_measure_task:
| Shown on the Logs page | Step ID | What the step does |
|---|---|---|
| Publish to Management Dashboard | run_measure_sync |
Loads the snapshot into the measurement schema and consolidates it for the dashboards, with its own aad-consolidation-*.log. Send it with the Prepare publication to Management Dashboard step and the dashboards log |
The job folder also holds log-alerts.json, which lists the alerts raised during the job, such as missing JAR files. Support may ask for it with the step logs.
Analysis logs in debug mode
Where Support asks for a debug log, turn on debug messages, run the job again, then retrieve the analysis log as above:
- In the application settings, turn on Include debug messages - see Using the debug options.
- Run the job again.
- Retrieve the analysis log.
The option turns itself off after the next analysis. Turn on Show SQL or Activate AMT Memory Profiling only when Support asks for them: both slow the analysis down.
Service logs
Service logs record the activity of the CAST Imaging components themselves: login, requests, communication between services, loading results into the viewer. They are kept per service, not per application.
From the UI
You need the Admin profile or a profile with the Administrator role.
- Select Settings, then Services, then the Logs tab.
- Choose a date range of up to 31 days that covers the problem.
- Select the services Support asked for, or select the checkbox in the Service header to select them all.
- Select DOWNLOAD. Several logs arrive as a single ZIP file with one folder per service.
See Logs tab for details. In 3.6.8-funcrel, each service has its own Service logs panel on the Services tab instead - see Download service logs in 3.6.8-funcrel. In earlier releases, only the node log can be downloaded from the UI: retrieve the others from disk.
The Logs tab names each service as follows:
| Component | Name on the Logs tab | Support may call it |
|---|---|---|
analysis-nodes |
One entry per node | Node log |
imaging-services |
Control Panel, Gateway, Auth Service, Console, SSO | Control Panel, Gateway, Auth, Console, SSO or Keycloak log |
imaging-viewer |
Imaging Viewer, ETL, Imaging API, AI Service, Neo4j | Viewer or server, ETL, API, AI Manager, Neo4j log |
dashboards |
The dashboards service | Dashboards log |
The Logs tab downloads service logs only. A node entry, for example, arrives as <host>-<port>_node-logs_<from>_<to>.zip and contains the node’s service log, analysis-node.log, but no analysis logs. Retrieve analysis logs from the application’s Logs page or from disk - see Analysis logs.
From disk on Microsoft Windows
| Service | Default location | Files |
|---|---|---|
| Node | %PROGRAMDATA%\CAST\Imaging\CAST-Imaging-Analysis-Node\logs |
analysis-node.log |
| SSO | %PROGRAMDATA%\CAST\Imaging\CAST-Imaging-SSO\logs |
sso.log for the current day and one .gz file per previous day, plus CAST-Imaging-SSO-log.txt, written by the Windows service that starts SSO |
| Console | %PROGRAMDATA%\CAST\Imaging\CAST-Imaging-Console\logs |
aip-gateway.log - despite its name, this is the log of the Console service |
| Gateway | %PROGRAMDATA%\CAST\Imaging\CAST-Imaging-Gateway |
gateway.log |
| Auth Service | %PROGRAMDATA%\CAST\Imaging\CAST-Imaging-Auth-Service |
auth-service.log |
| Control Panel | %PROGRAMDATA%\CAST\Imaging\CAST-Imaging-Control-Panel |
control-panel.log |
| Viewer | %PROGRAMFILES%\CAST\Imaging\CAST-Imaging-Viewer\logs |
imaging-service.log, nginx_access.log, nginx_error.log, error.log |
| ETL | %PROGRAMFILES%\CAST\Imaging\CAST-Imaging-Viewer\logs |
imaging-etl.log, and one import log per application, such as <application>_local-default-<number>.log |
| Imaging API | %PROGRAMFILES%\CAST\Imaging\CAST-Imaging-Viewer\logs |
imaging-api.log |
| AI Service | %PROGRAMFILES%\CAST\Imaging\CAST-Imaging-Viewer\logs |
ai_service.log, imaging-agents.log, agents_server.log, graphrag_server.log, imaging_graphrag.log |
| Neo4j | %PROGRAMFILES%\CAST\Imaging\CAST-Imaging-Viewer\logs |
neo4j.log, debug.log, query.log, security.log, neo4j-service.<date>.log |
| Dashboards | %PROGRAMDATA%\CAST\Imaging\CAST-Imaging-Dashboards\logs |
restapi.log |
Each folder is on the machine where that component is installed - see Deployments with several machines. The Gateway, Auth Service and Control Panel write their log directly in the component folder, not in a logs subfolder. The imaging-windows-*.log and service-error.log files in the viewer folder are written by the Windows services that start each viewer component: send them when a viewer service does not start. In releases before 3.6.8-funcrel, the SSO log is CAST-Imaging-SSO-log.txt in the SSO folder.
To send everything from one machine, run the following in PowerShell as an administrator. The services keep their logs open, so the command copies them to a temporary folder first, then compresses the copy into cast-imaging-logs-<machine>.zip on your desktop. Folders that do not exist on the machine are skipped, so you can run the same command on every machine of a distributed deployment:
$dst = "$env:TEMP\cast-imaging-logs"
Remove-Item $dst -Recurse -Force -ErrorAction SilentlyContinue
$src = @{
  "analysis-node" = "$env:ProgramData\CAST\Imaging\CAST-Imaging-Analysis-Node\logs\*"
  "sso"           = "$env:ProgramData\CAST\Imaging\CAST-Imaging-SSO\logs\*"
  "console"       = "$env:ProgramData\CAST\Imaging\CAST-Imaging-Console\logs\*"
  "gateway"       = "$env:ProgramData\CAST\Imaging\CAST-Imaging-Gateway\*.log"
  "auth-service"  = "$env:ProgramData\CAST\Imaging\CAST-Imaging-Auth-Service\*.log"
  "control-panel" = "$env:ProgramData\CAST\Imaging\CAST-Imaging-Control-Panel\*.log"
  "dashboards"    = "$env:ProgramData\CAST\Imaging\CAST-Imaging-Dashboards\logs\*"
  "viewer"        = "$env:ProgramFiles\CAST\Imaging\CAST-Imaging-Viewer\logs\*"
}
foreach ($k in $src.Keys) {
  if (Test-Path $src[$k]) {
    New-Item -ItemType Directory -Path "$dst\$k" -Force | Out-Null
    Copy-Item $src[$k] "$dst\$k" -Recurse -Exclude *.zip
  }
}
Compress-Archive -Path "$dst\*" -DestinationPath "$env:USERPROFILE\Desktop\cast-imaging-logs-$env:COMPUTERNAME.zip" -Force
Remove-Item $dst -Recurse -Force
The command leaves out the <application>.zip files of the viewer folder: these are the exported results sent to the ETL, and can be large. Send them only when Support asks for them.
From disk on Linux via Docker/Podman
Each folder is on the machine where that component is installed - see Deployments with several machines. The logs are written to the host, so you can read them without access to Docker:
| Service | Default location | Files |
|---|---|---|
| Node | /opt/cast/core/logs |
analysis-node.log |
| Control Panel, Gateway, Auth Service, Console, SSO | /opt/cast/imaging-services/logs, one subfolder per service: control-panel, gateway, auth-service, console, sso |
<service>.log, for example gateway.log |
| Viewer | /opt/cast/installation/imaging-viewer/logs |
imaging-service.log, and access.log for the requests received |
| ETL | /opt/cast/installation/imaging-viewer/logs |
imaging-etl.log |
| Imaging API | /opt/cast/installation/imaging-viewer/logs |
imaging-api.log |
| AI Service | /opt/cast/installation/imaging-viewer/logs |
ai_service.log, agents/imaging-agents.log, graphrag/imaging_graphrag.log |
| Neo4j | /opt/cast/installation/imaging-viewer/logs |
neo4j.log, debug.log, query.log, security.log |
| Dashboards | /opt/cast/imaging-dashboards/logs |
restapi.log |
The node, imaging-services and dashboards logs roll over daily: the folder holds the current log plus one compressed file per previous day, for example gateway.log.2026-11-10.0.gz. To send everything from one machine, compress the folders that exist on it. On a machine that does not host every component, tar reports the missing folders and compresses the others. Run the command on every machine of a distributed deployment:
$ sudo tar czf cast-imaging-logs-$(hostname).tar.gz /opt/cast/core/logs /opt/cast/imaging-services/logs /opt/cast/installation/imaging-viewer/logs /opt/cast/imaging-dashboards/logs
The imaging-services and dashboards folders can be moved with IMAGING_LOGS_HOST_MACHINE in the component’s .env file - see Docker/Podman file storage locations. The viewer folder is inside the imaging-viewer installation folder, so it moves with the installation.
Container logs (Linux via Docker/Podman)
Every container also writes to its standard output. Support asks for this when a container does not start, or when the problem is not in a log file. Run the following on the machine that hosts the container, as a user that can run Docker commands, replacing <container> with a name from the table:
$ docker logs <container> > <container>.log 2>&1
To save the output of every container on the machine at once:
$ for c in $(docker ps -a --format '{{.Names}}'); do docker logs "$c" > "$c.log" 2>&1; done
| Component | Containers |
|---|---|
imaging-services |
gateway, console, auth-service, sso-service, control-panel, postgres (embedded PostgreSQL only) |
analysis-node |
analysis-node |
imaging-viewer |
server, etl, imaging_apis, open_ai_manager, neo4j |
dashboards |
dashboards |
Use podman instead of docker on Podman. Run docker ps -a to list the containers on the machine, including stopped ones.
Browser logs: console and HAR
When the problem appears in the UI, for example a blank page, an error message or a view that does not load, Support may ask for the browser console or a HAR file. Both are produced by your browser, so no access to the servers is needed. These steps apply to Google Chrome and Microsoft Edge:
- Open the page where the problem occurs, and press
F12to open the developer tools. - In the Network tab, select Preserve log, then reproduce the problem.
- To save the HAR file, right-click in the list of requests and select Save all as HAR with content.
- To save the console, open the Console tab, right-click in it and select Save as.
A HAR file contains the content of the requests, including authentication tokens. Send it to Support only, and log out of CAST Imaging once you have saved it so the tokens expire.
Installation and update logs
| Platform | Components | Location |
|---|---|---|
| Microsoft Windows | imaging-services, analysis-node, dashboards |
%PROGRAMDATA%\CAST\CAST\.install, one file per run named YYYYMMDDHHmm_cast-imaging-[install|update|remove].log |
| Microsoft Windows | imaging-viewer |
%PROGRAMFILES%\CAST\Imaging\CAST-Imaging-Viewer\logs: imaging-viewer-installer.log and neo4j-installer.log |
| Linux via Docker/Podman | imaging-viewer |
/opt/cast/installation/imaging-viewer/logs/cast-imaging-install.log |
| Linux via Docker/Podman | Other components | No log file: save the console output of the installer or of the update script, and the container logs of any container that does not start |
Delivery folder and schema backup
This is not a log, but Support may ask for it to reproduce a problem on their side. It is an application backup that contains, depending on the options you choose:
- the application schemas
*_MNGT,*_LOCALand*_CENTRAL, in.cssbackupformat - the application’s delivery folder, which holds the delivered source code, the analysis settings such as exclusion patterns, and the fast scan data
You need the Admin profile or a profile with the Administrator role:
- Open the application’s details from the Actions menu, as for the CAST Support section, then expand Backups.
- Select BACKUP APPLICATION, then select Backup application schemas, Backup delivery folder, or both, depending on what Support asked for. Select BACKUP.
- When the backup is listed, select its download icon. Its Type column shows Schema, Delivery or All.
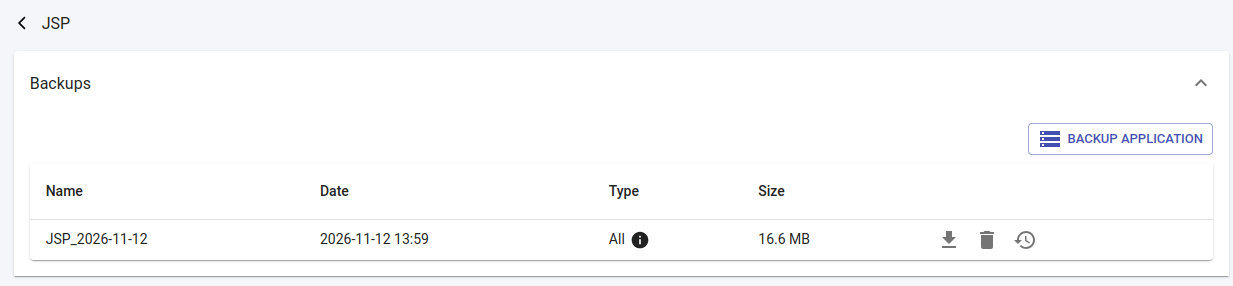
See Managing application backups for details. Backups are also stored on disk, in the backup folder of the shared common-data folder: <common-data>/backup/<application>/<application>_YYYY-MM-DD.zip.
- The delivery folder contains your source code, and the schemas contain the analysis results. Check that your policy allows you to send them. A backup can be large: agree with Support on how to transfer it.
- The backup does not include the
imaging-viewerresults stored in Neo4j.
Other logs
| Log | Where to find it |
|---|---|
| PostgreSQL | Embedded instance on Linux: /opt/cast/cast-imaging-db-data/data/log, one postgresql-<date>_<time>.log file per day, readable by root only: sudo cp -r /opt/cast/cast-imaging-db-data/data/log ./postgres-logs. Other instances: the log folder of the PostgreSQL data directory |
| CAST Extend local server | docker logs cast_extendproxy - see CAST Extend local server |
| CAST Imaging MCP Server | See the troubleshooting section of the MCP Server installation page for your platform |
| Kubernetes deployments | See Downloading logs |