Trends
Overview
Where the Overview section shows the most recent value for a measure, the Trends section shows the direction of travel across successive snapshots, so you can tell at a glance whether an application is improving or deteriorating. Trends are available on both the multi-application and single-application landing pages.
The Trends section is not displayed when the Measurement schema holds more than 1500 snapshots. The snapshot threshold is a configurable dashboard setting - see Configuration options.
Health Measure trend tiles
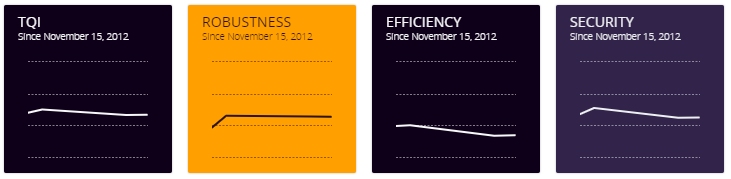
One tile is provided for each of the following Health Measures:
- TQI (Total Quality Index)
- Robustness
- Efficiency
- Security
Each tile plots the grade trend over successive snapshots.
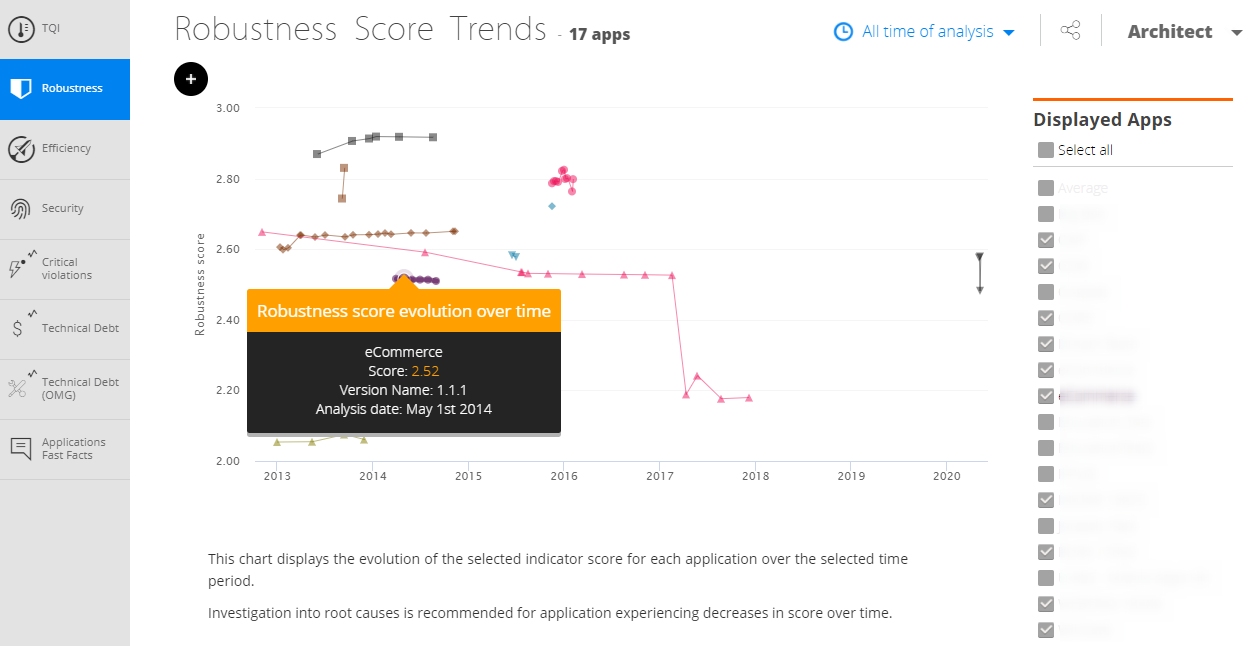
At multi-application level, clicking a tile shows the grade trend for every application as a line graph. The Average entry in the Displayed Apps panel is not an application: it plots the average grade of all the others. Roll over any point to see the values for that snapshot:
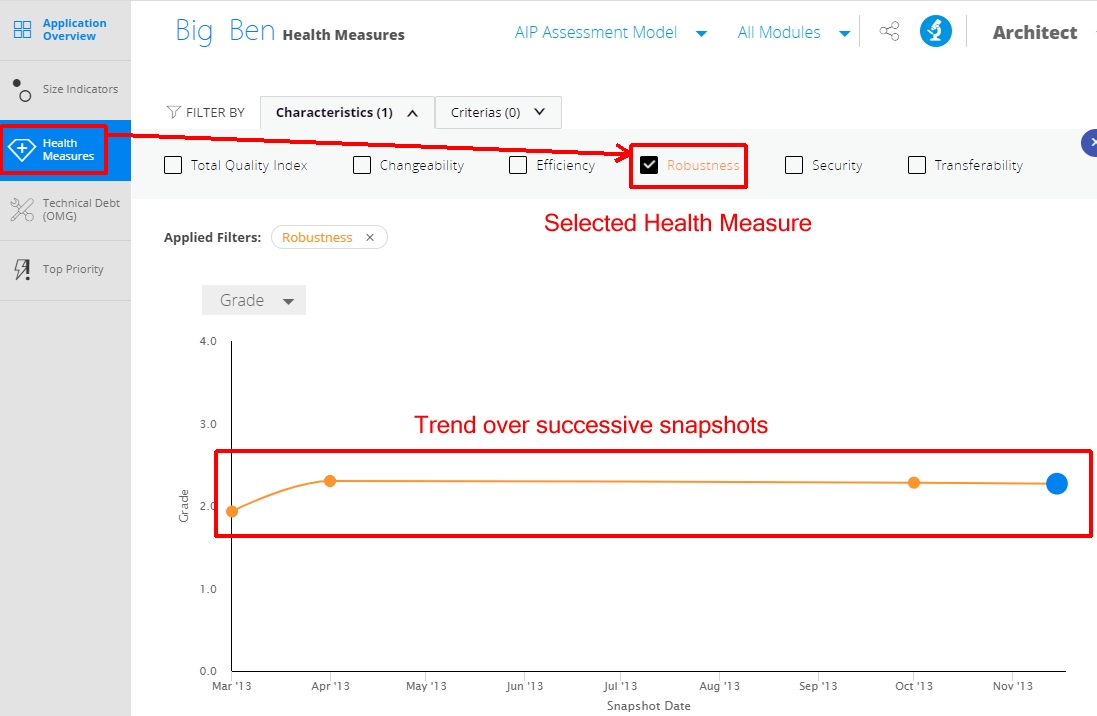
At single-application level, clicking a tile drills into the detail for that Health Measure and its trend over successive snapshots:
Critical Violations trend tile
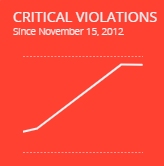
Shows the number of critical violations over successive snapshots, so a sudden rise is obvious without opening anything.
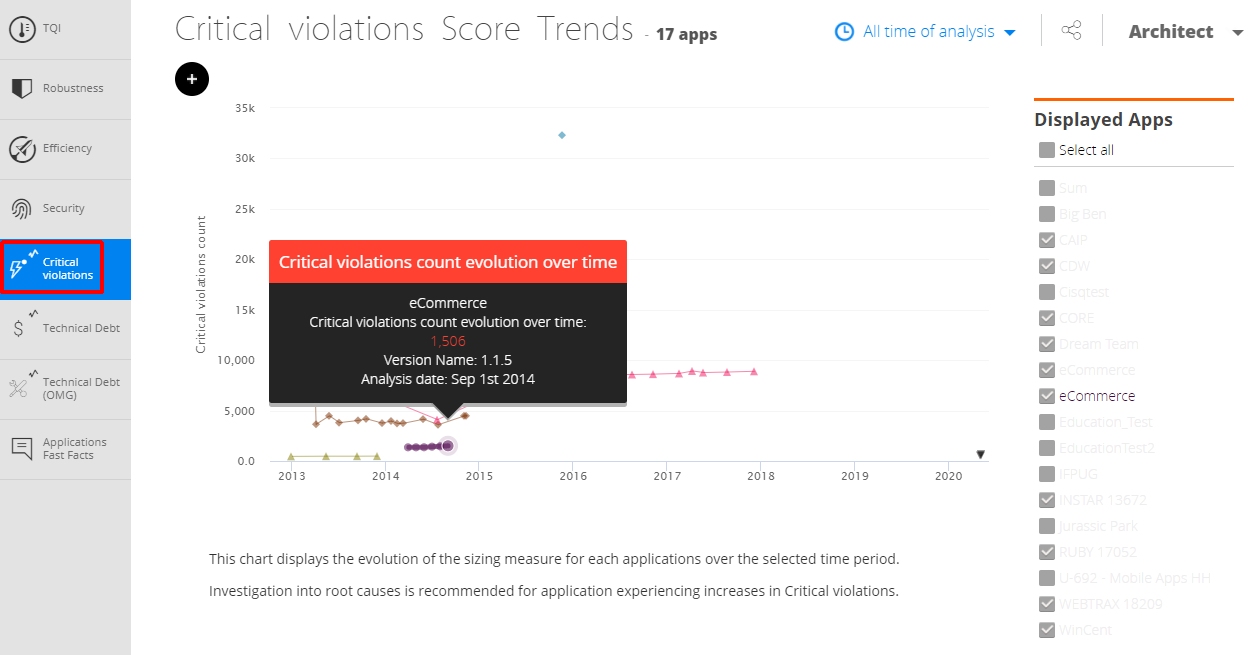
At multi-application level, clicking the tile plots critical violations per application. The Sum entry in the Displayed Apps panel totals all the others:
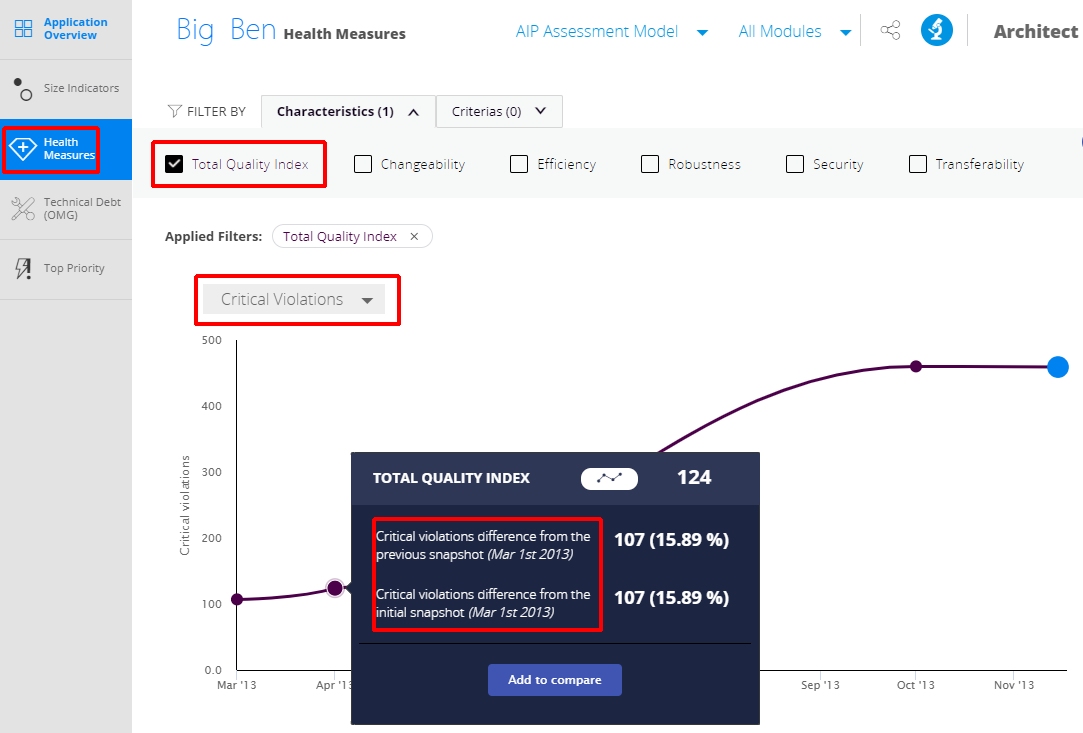
At single-application level, clicking the tile opens the drill-down for the TQI Health Measure with the Critical Violations filter already applied:
Technical Debt trend tile
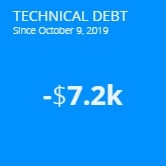
Shows how the Technical Debt value has moved since the date shown on the tile, which is the date of the first snapshot in the period:
- A negative value means debt has decreased. This is a positive trend.
- A positive value means debt has increased. This is a negative trend and worth investigating.
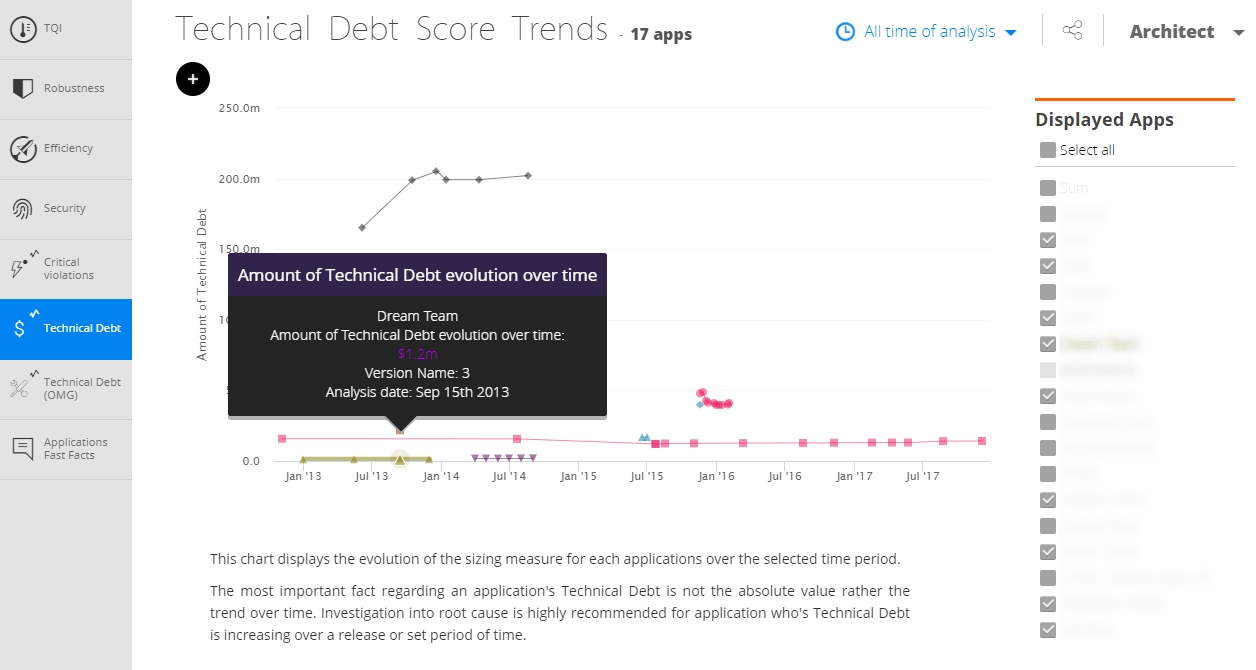
At multi-application level, clicking the tile plots Technical Debt per application, with Sum totalling the others:
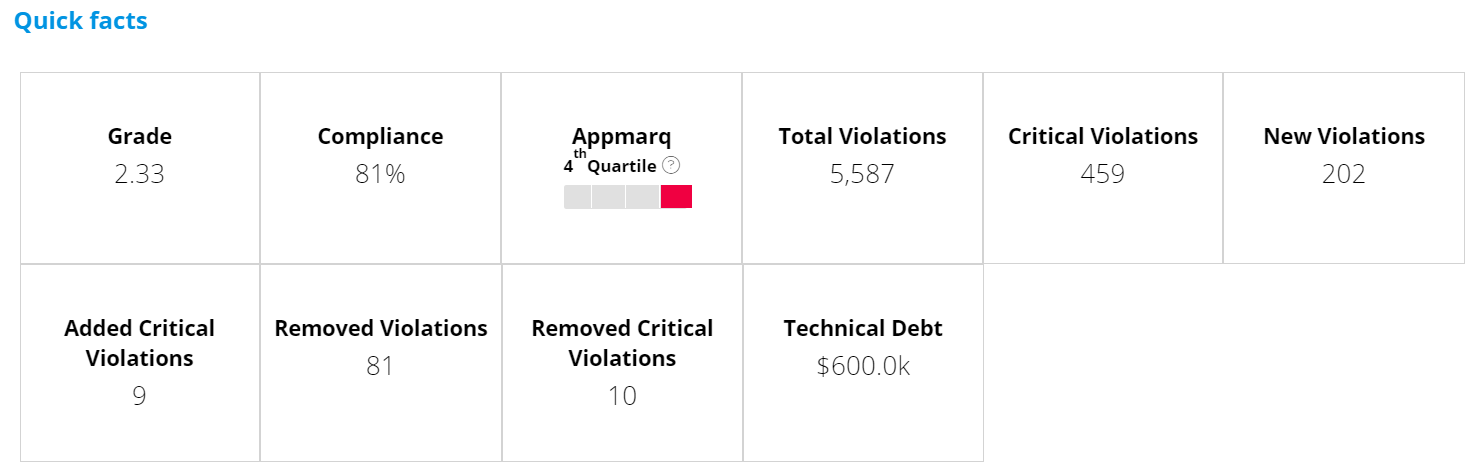
At single-application level, clicking the tile drills into the Quick facts section:
Technical Debt (OMG) trend tile
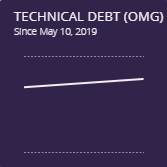
Shows the trend for ATDM (Automated Technical Debt Measure) in man-days. ATDM is an OMG standard submitted by the CISQ Consortium that estimates future corrective maintenance cost, as set out in the OMG ATDM specification 1.0 . An increasing trend warrants investigation.
This tile only carries data when the OMG Technical Debt extension was installed before the snapshot was generated.
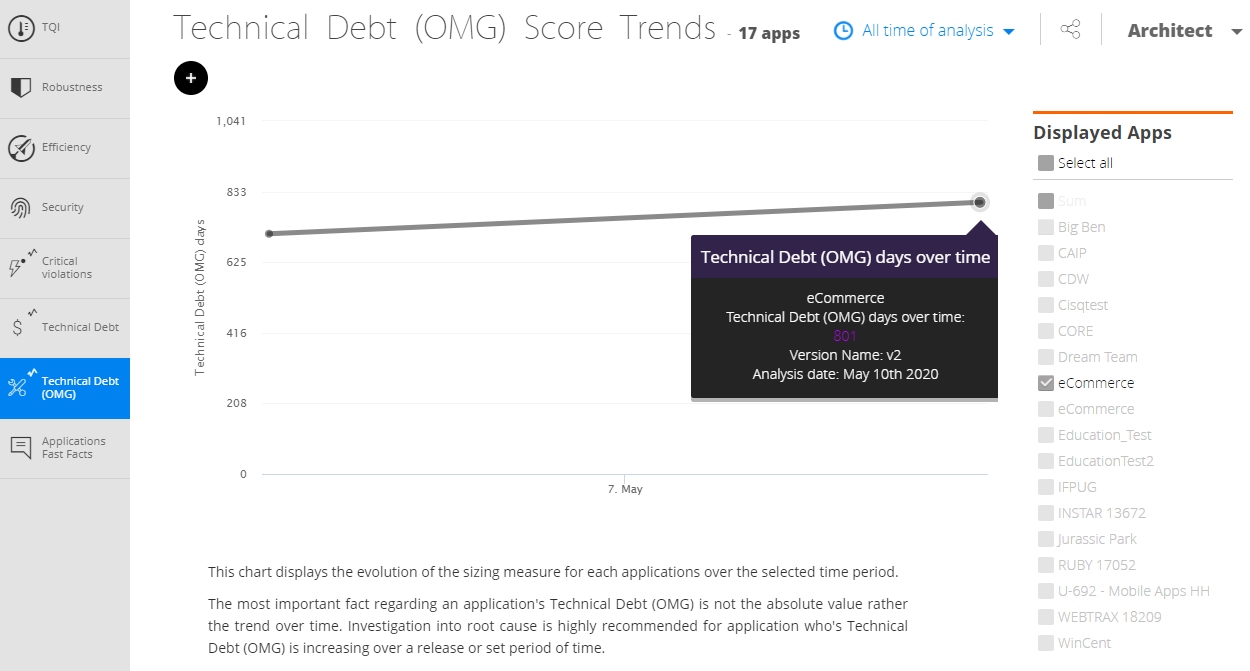
At multi-application level, clicking the tile plots Technical Debt (OMG) per application, with Sum totalling the others:
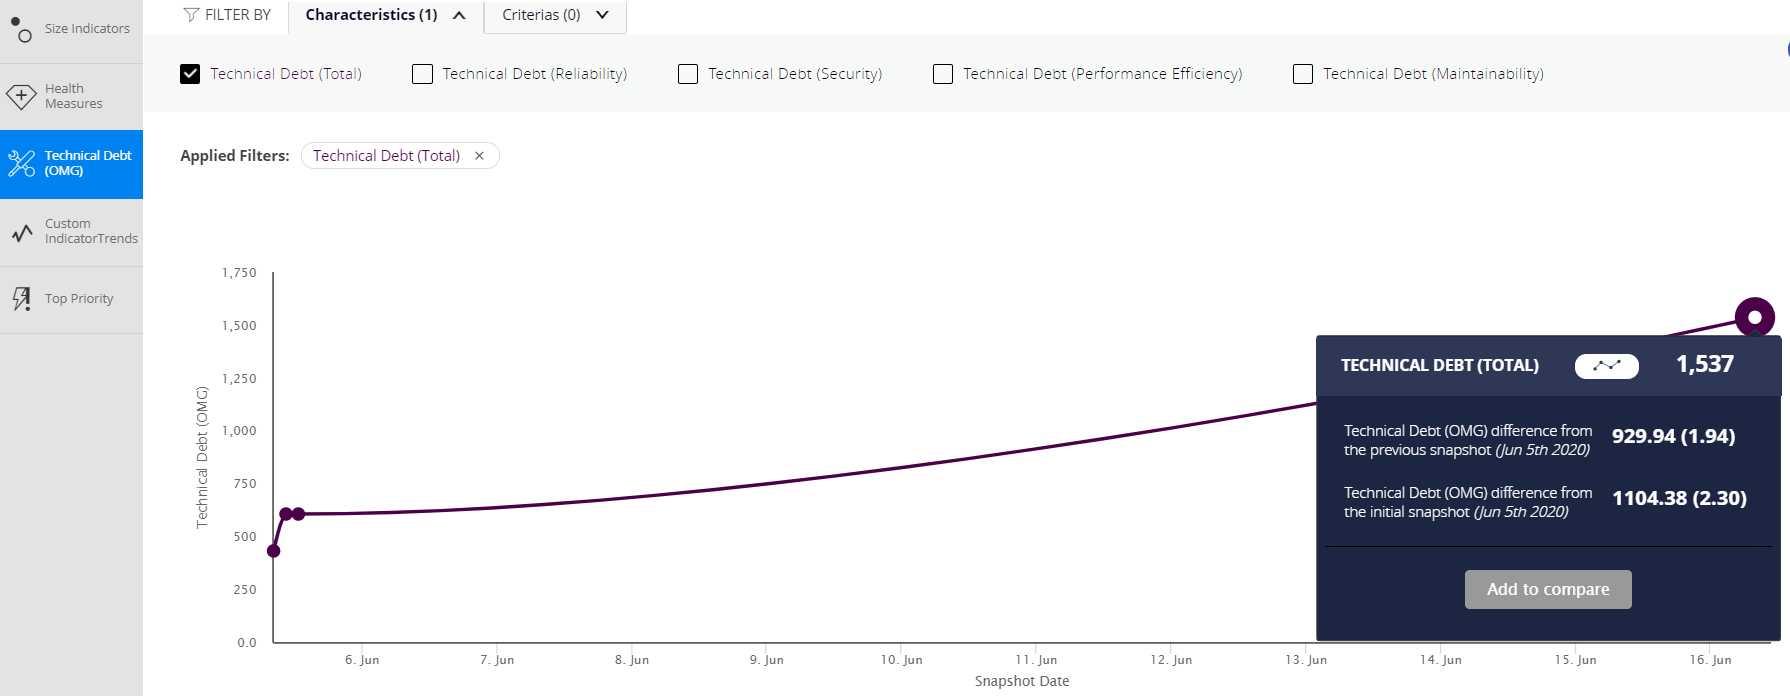
At single-application level, clicking the tile shows the detail behind the trend:
Application Fast Facts tile
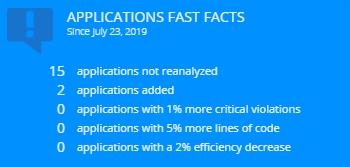
Available on the multi-application landing page only. It counts, for the selected time period, the applications that:
- have not been analyzed
- were added
- have 1% more critical violations - lower is better
- have 5% more lines of code
- have a 2% efficiency decrease - lower is better
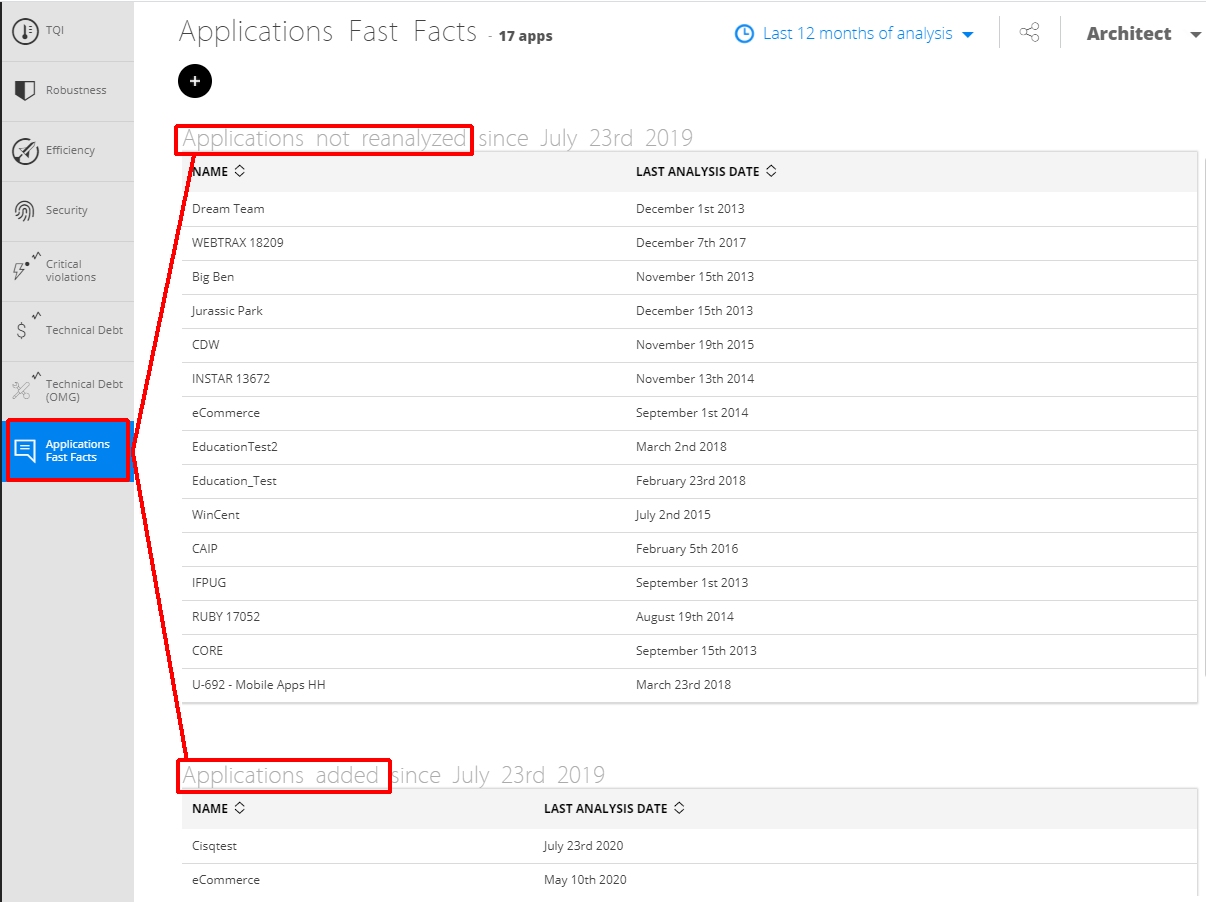
Clicking the tile lists the applications behind the “not analyzed” and “added” counts: