Risk investigation
Overview
Risk investigation approaches an application through its assessment model: you start from a Health Measure, narrow to a technical criterion, narrow again to a rule, and end at the objects violating it with their source code on screen. It is the view to use when you want to know which rules are failing and how badly.
Reach it from the sidebar, or by clicking the Risk Model tile on the home page:
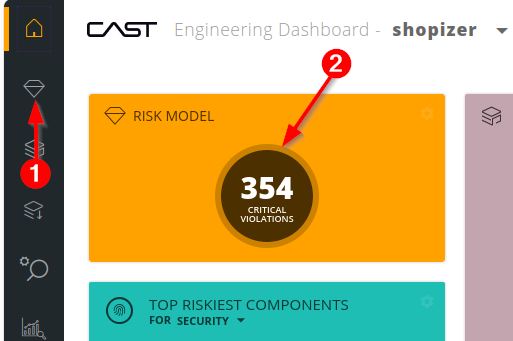
What you see at the top level is governed by the filterHealthFactor setting, which ships as false in the Engineering Dashboard - so all Business Criteria are listed, whether or not they are categorised as Health Measures. Setting it to true restricts the list to Health Measures only. See Configuration options.
How the drill-down works
Data sits in two tables. You select on the left, and what contributes to your selection appears on the right. Each selection then shifts left to make room for the next level down.
Start with the Health Measures:
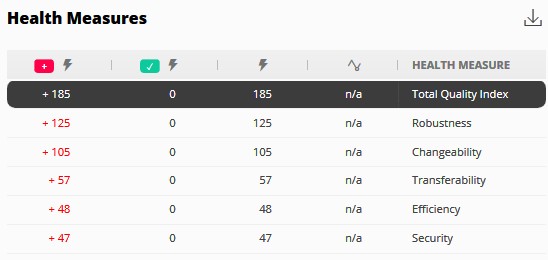
Selecting one lists its contributing technical criteria on the right:
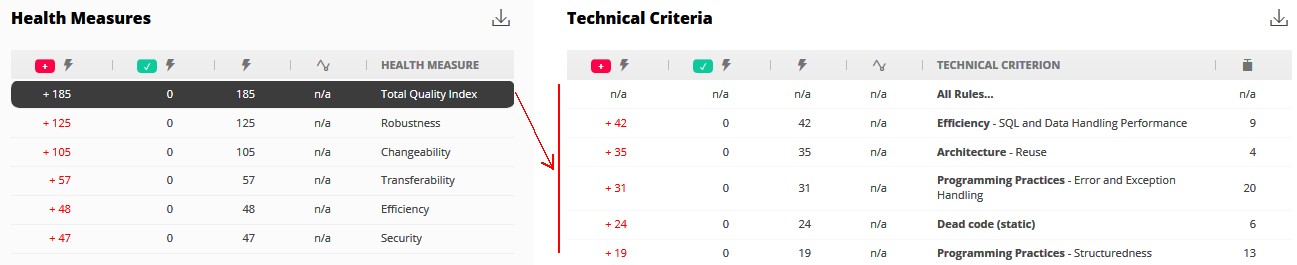
The first row is All Rules…, which skips a level and lists every rule contributing to the Health Measure:

Selecting a technical criterion instead lists its rules:

And selecting a rule brings up its detail: the objects in violation, the computing details, and the documentation.
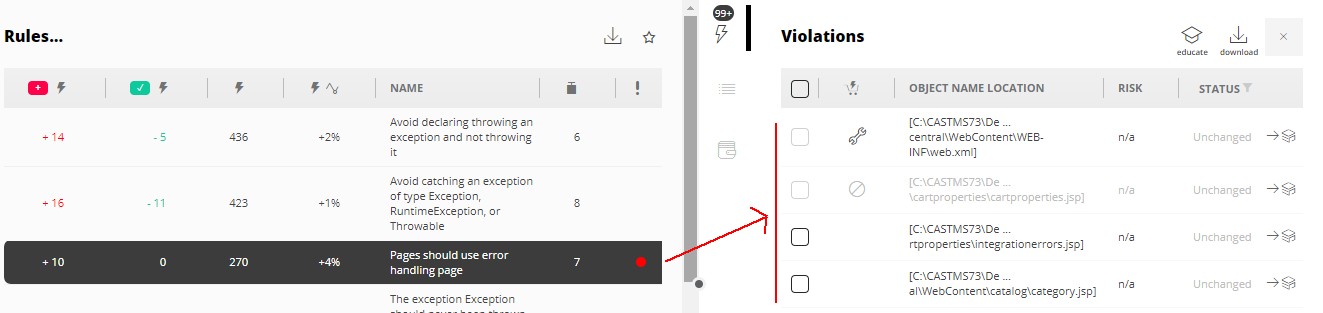
A technical criterion whose grade is 0 is never displayed. That happens when the weight of every contributing rule has been set to 0.
Showing more violations
Only 10 violations are listed initially, to keep the page fast. SHOW MORE adds them in increments:
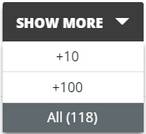
Choosing All stops at 5000 by default. That ceiling is configurable - see violationsCount. Where there are many violations, the search button filters the list on the object name and location.
What a rule shows you
Violations
Expanding Violations lists the objects breaking the rule:
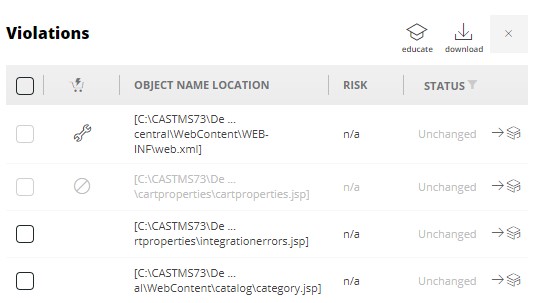
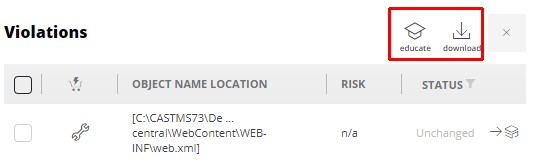
Two icons sit in the section header:
| Icon | Action |
|---|---|
| Educate | Adds the rule to the Education list |
| Download | Exports the violation list to Excel |
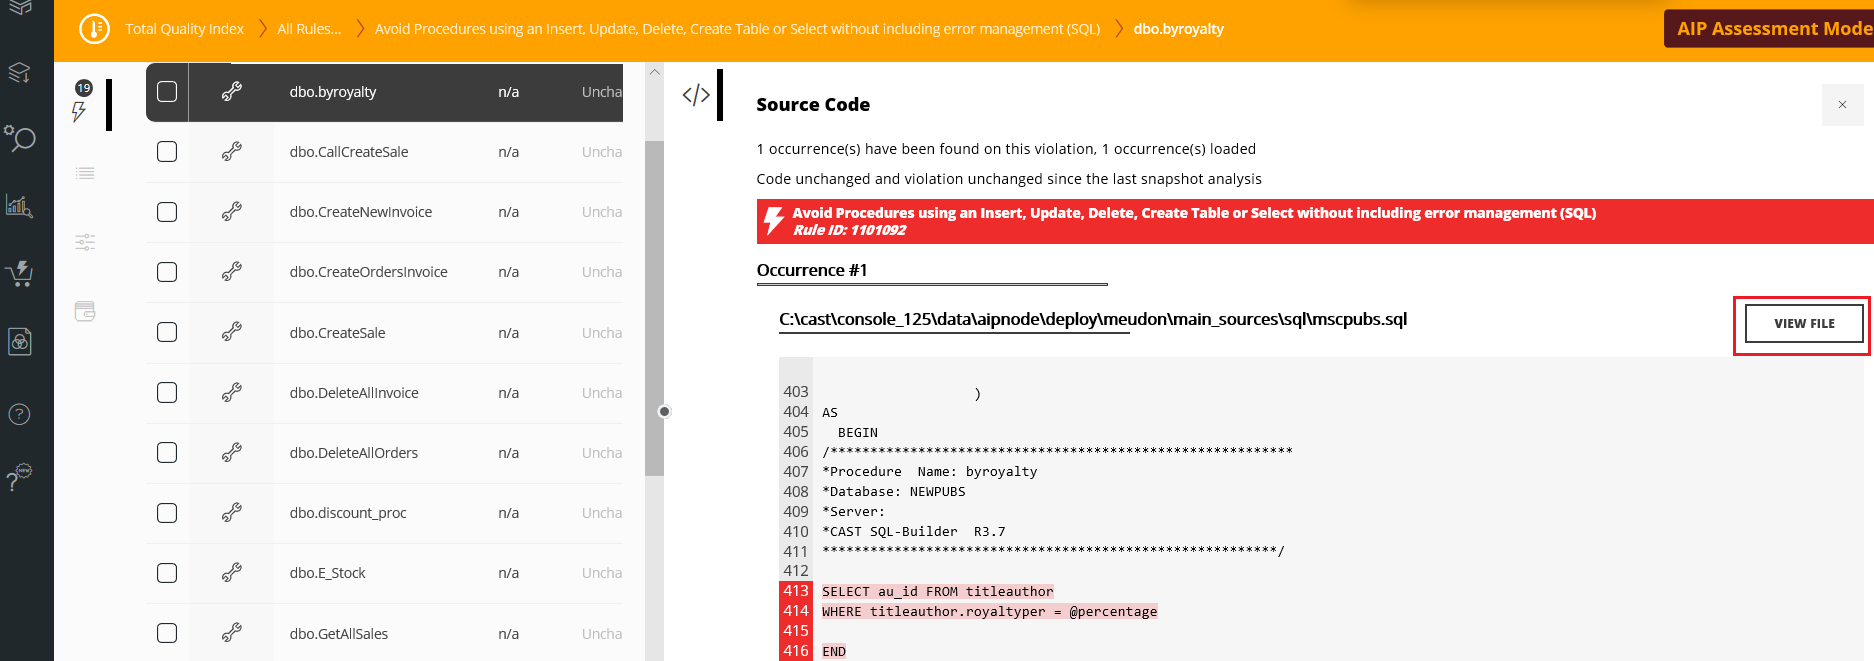
Source code
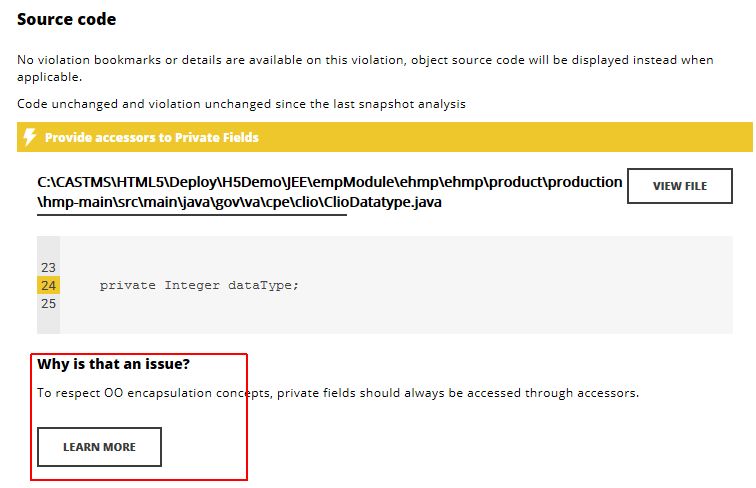
Select an object to see the code. The dashboard shows either the object in violation or, where the analysis produced them, the specific violation details such as bookmarks and paths. The rule name is highlighted in yellow for a standard rule and red for a critical one:
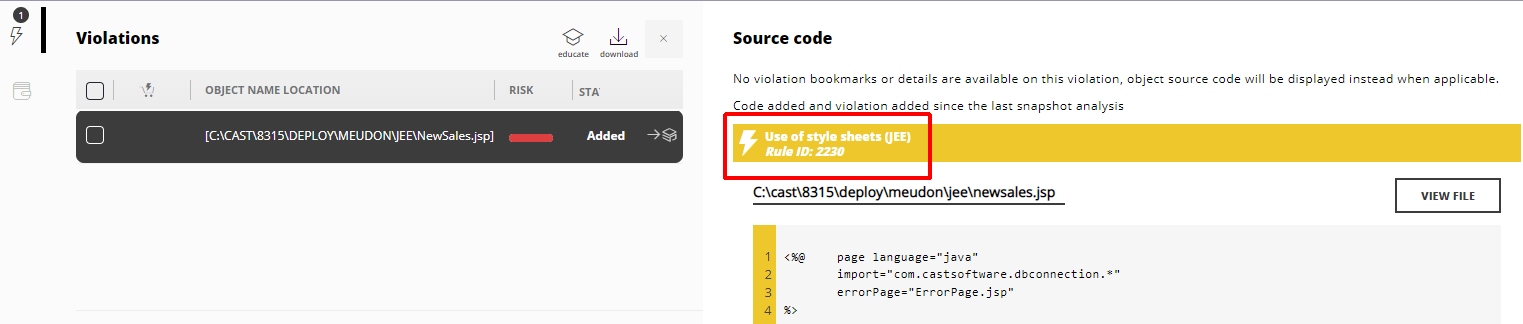
VIEW FILE opens the complete file in a new tab, with the application name, snapshot reference and file name for context:
Source code comes from the most recent snapshot generated, even if that snapshot has since been deleted. Deleting the latest snapshot does not restore the previous snapshot’s code, which can produce a confusing result: a violation reported against an older snapshot, shown alongside newer code in which the violation no longer appears.
Source code is also unavailable where the TQI Health Measure has been disabled entirely. The analysis log reports this as “The selected snapshot is not the latest, the code source will not be updated in the central schema”.
Two rule types display differently, because pointing at a single line would not help:
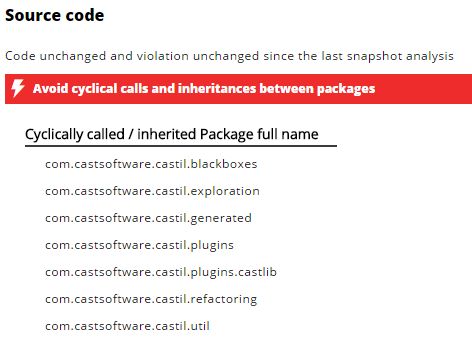
Cyclical calls, as in “Avoid cyclical calls and inheritances between packages”. Since the problem is that two packages refer to each other, the dashboard lists the packages involved rather than a code fragment:
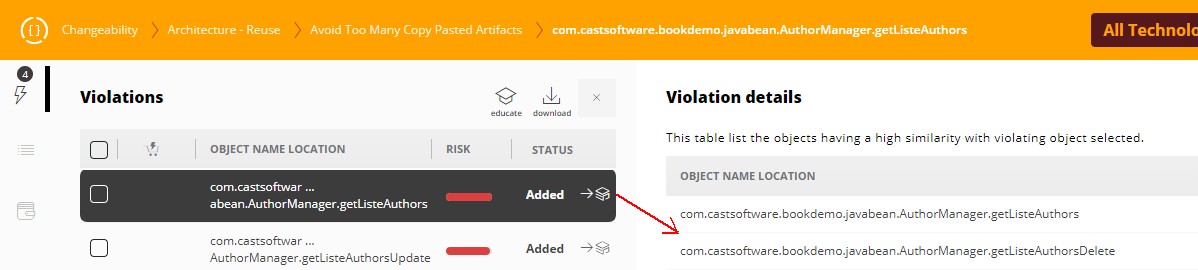
Copy and pasted code, as in “Avoid Too Many Copy Pasted Artifacts”. The dashboard lists the objects that closely resemble the selected one:
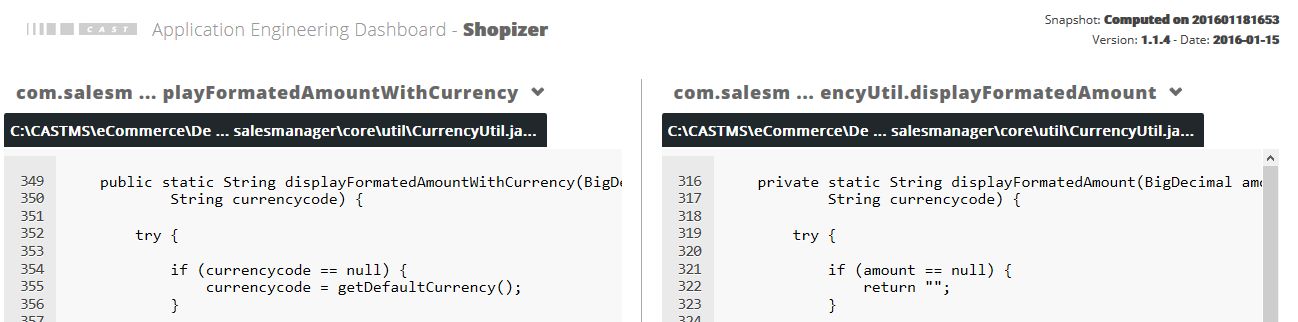
Clicking one of those opens a side-by-side comparison, with a component selector and file selector on each side so you can line up the fragments:
Bookmarks
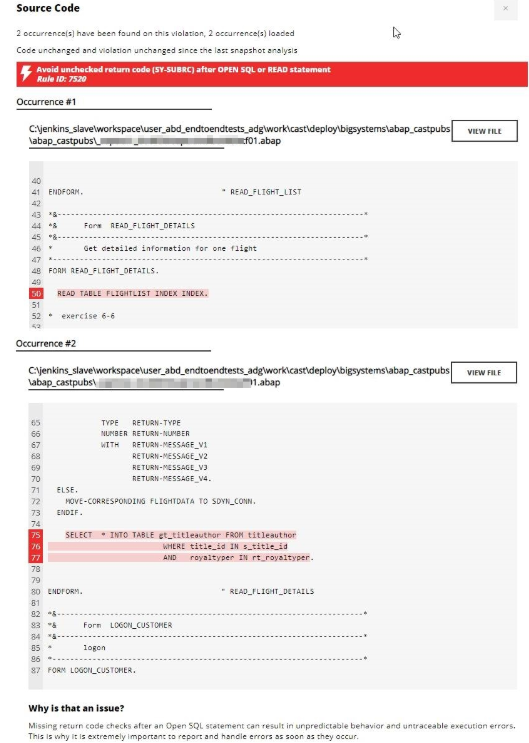
Where the analysis recorded bookmarks, the dashboard shows each occurrence of the violation inside the object, with its code fragment and file. The bookmark is highlighted yellow for a standard rule, red for a critical one:
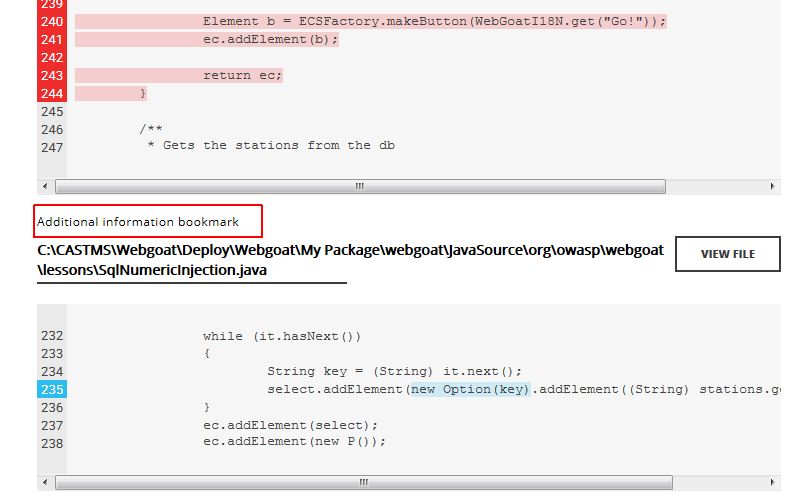
Where a single occurrence has several bookmarks, the main one is the primary and the rest are secondary, highlighted in blue:
MORE OCCURRENCES appears beyond five occurrences in an object, and MORE BOOKMARKS beyond five bookmarks in one defect.
In a file larger than 500KB, only 500 lines either side of the bookmark are loaded. Use the control in the source code panel to load more.
Injection bookmarks
Violations of OWASP injection rules, such as “Avoid SQL injection vulnerabilities (CWE-89)”, are presented as a trail rather than a single location, because the flaw is the path data takes:
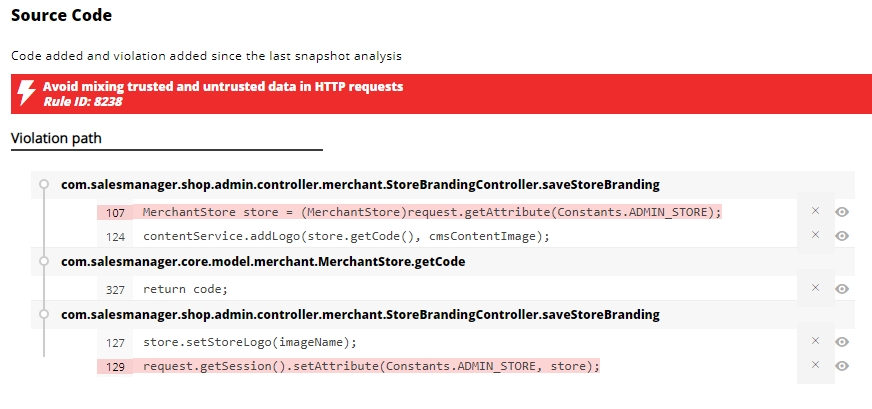
Two bookmarks carry specific meaning:
- The first marks the unsafe data acquisition - where untrusted data enters.
- The second marks the resource access using that tainted data.
A flaw can span several files. Use the eye icon to open the file a bookmark sits in.
Violation details
Beneath the source code, this section names the violation and gives its associated values:
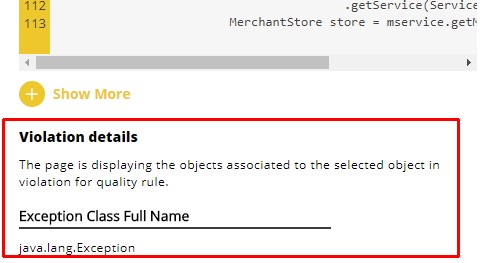
Where the rule has no such values, it reports “No violation details for this Rule”.
Why is that an issue?
Shows the rationale behind the rule that has been broken. Learn More opens its full description:
Computing details
How widely the rule was checked, and how much of the application passed:

- Total checks is the number of objects checked against the rule.
- The module count shows how many modules it was checked in.
- % compliance is the proportion of checked objects with no violation. Higher is better.
Expanding the section breaks this down per module:
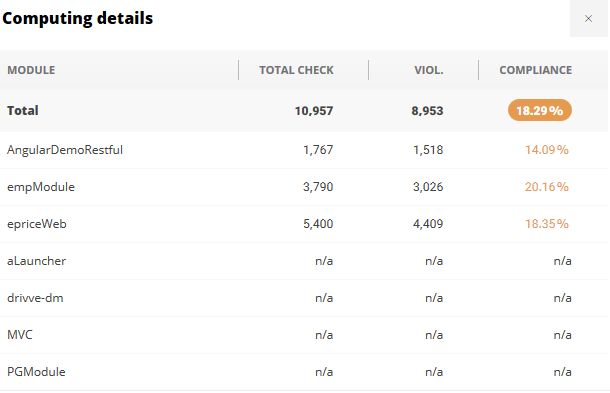
| Column | Meaning |
|---|---|
| Module | The module, as defined when the snapshot was configured |
| Total Check | Objects in the module checked against the rule |
| Viol. | Objects in the module violating it |
| Compliance | The percentage of the module’s checked objects that comply |
The Total row is cumulative across the modules listed.
Parameter details
For a parameterized rule, the parameter name, technology and value, for the current snapshot and the previous one:

This section appears even where the rule has no violations. Rules without parameters report “No parameter details available”.
Rule documentation
A full description of the rule:
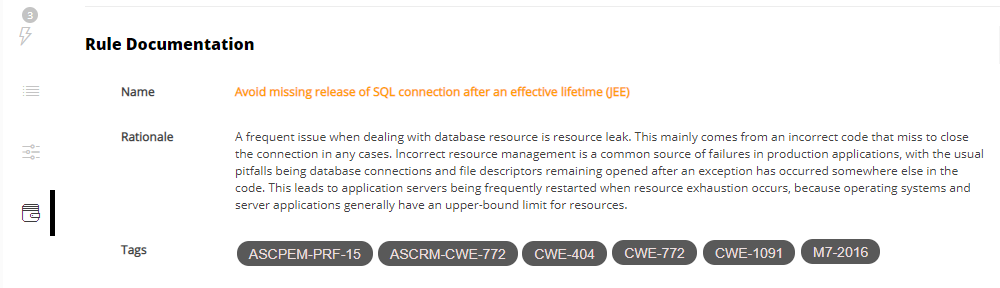
Rolling over a tag shows its name and links to the rule in the rule portal. Rules with no tags show “No Tag”.
Architecture models
Where a rule carries architecture model data, this section replaces Violations as the default and draws the model as an interactive diagram: green arrows are permitted dependencies between layers, red arrows are forbidden ones, each labelled with its violation count.
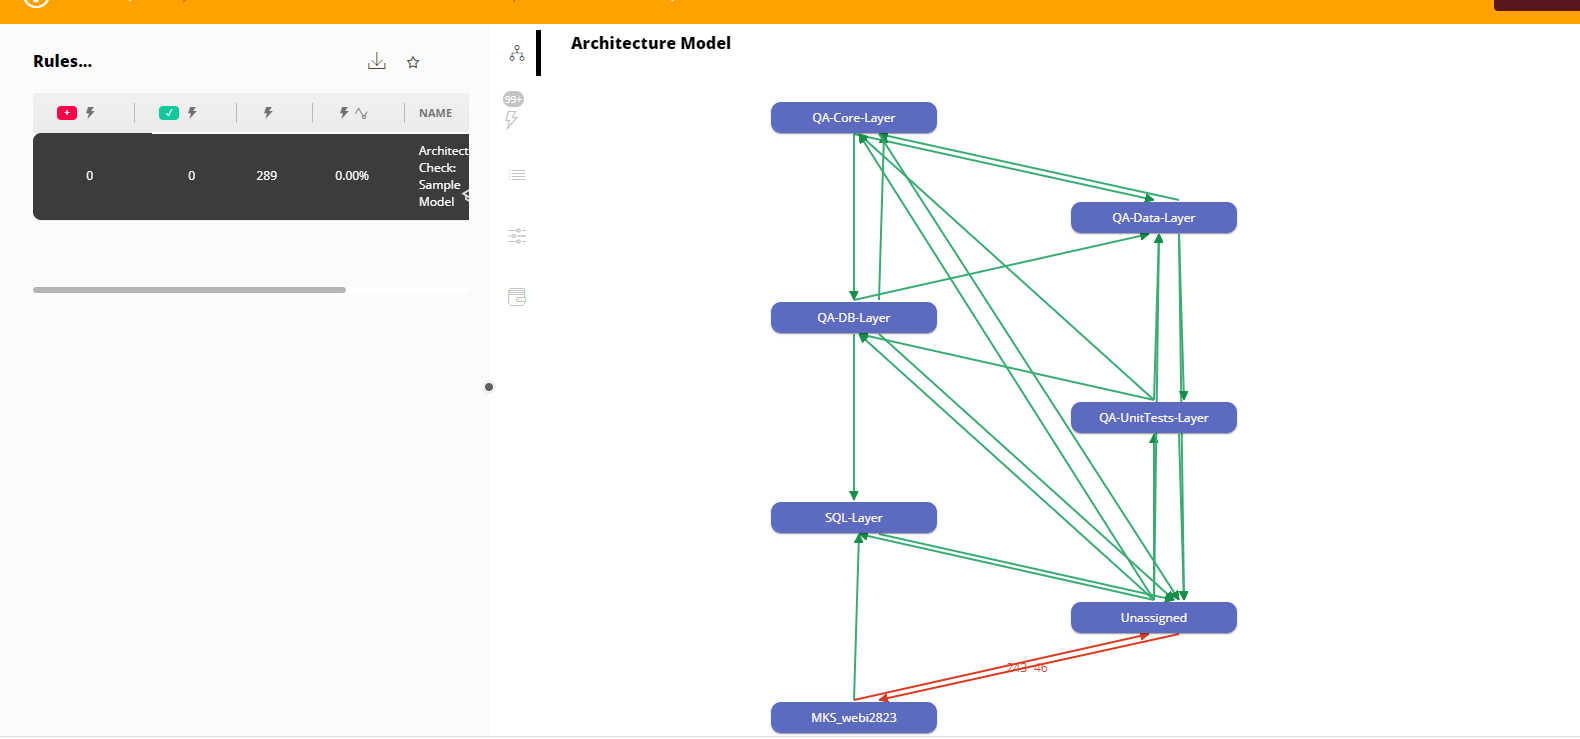
Nodes can be dragged into a more readable arrangement. Clicking a red arrow replaces the violation table with just the violations between those two layers, which is a narrower list than the default showing every violating object regardless of layer:
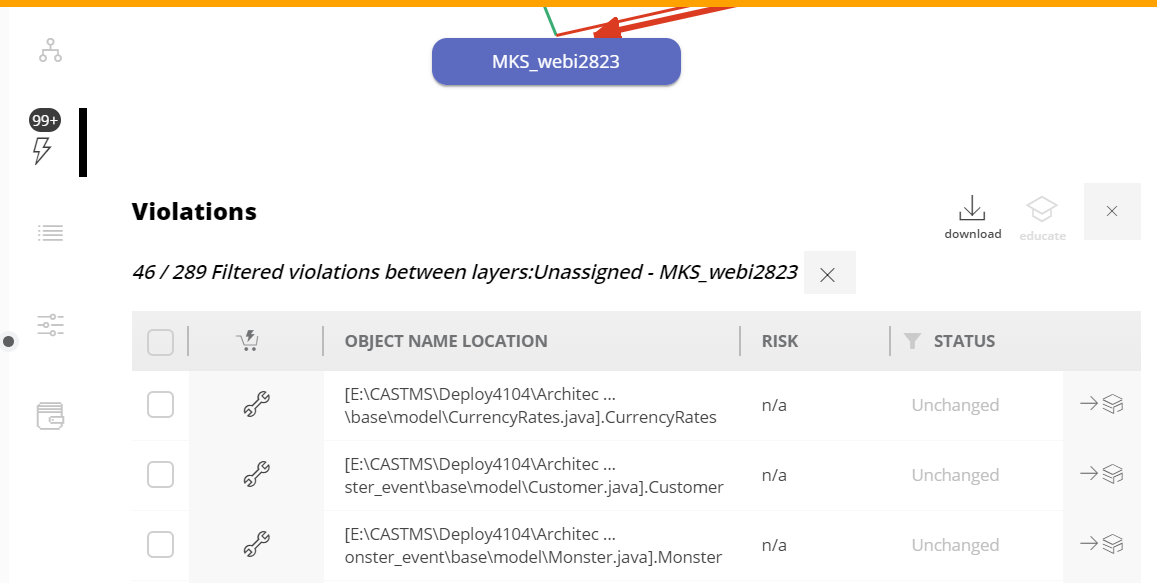
A rule with no layers reports “No layers available”.
Distributions and measures
Not everything in the assessment model is a rule.
A distribution sorts the application’s objects into categories rather than passing or failing them - Low/Small (green), Average, High/Large, and Very High/Very Large (red). A Status column shows how each object changed since the previous snapshot:
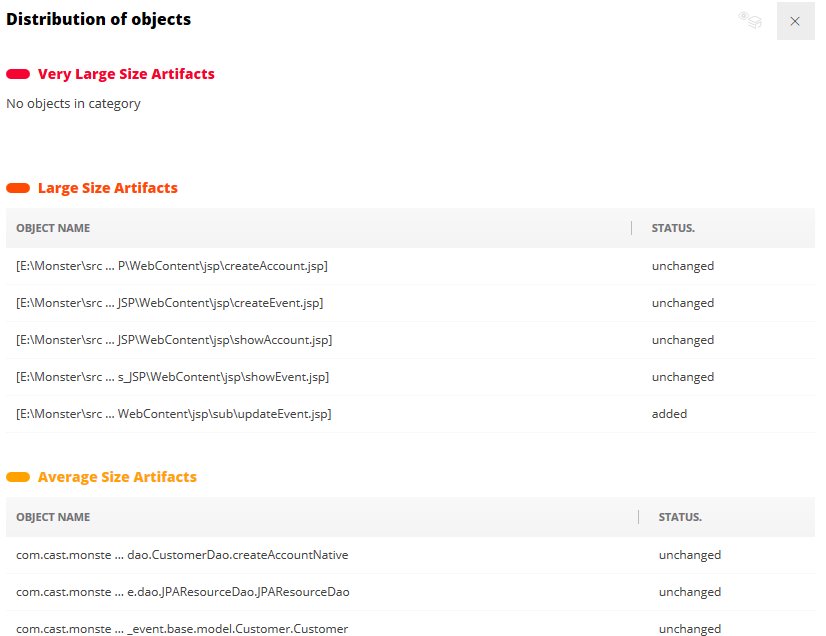
Distributions also document the parameters that feed the metric, with the object types involved and how many objects fall into each parameter.
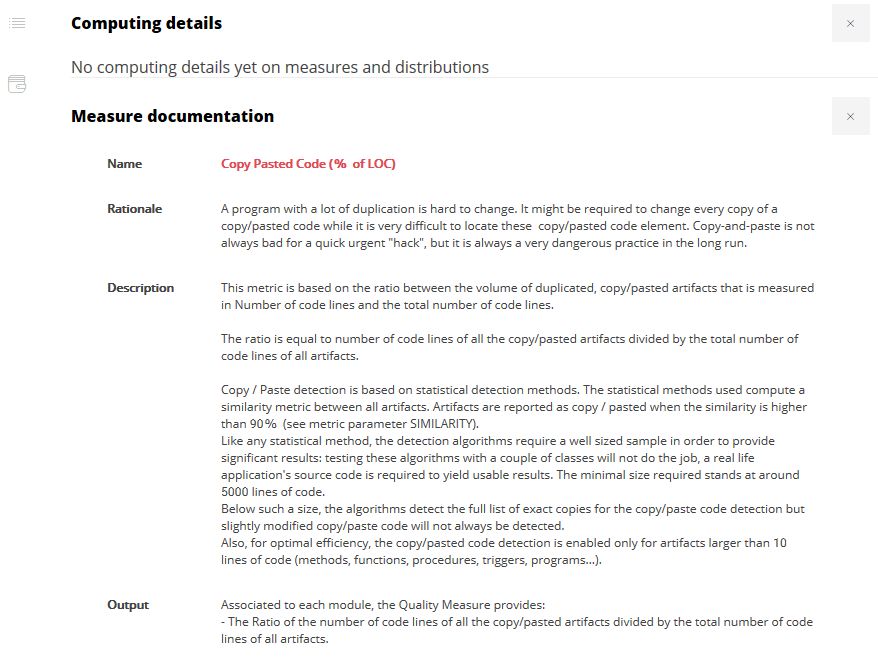
A measure is never violated, so the Engineering Dashboard can only show its documentation. Use the Management Dashboard if you need to work with measures:
Reading the tables
Columns you will see at every level
| Column | Meaning |
|---|---|
| Added | Violations added to this snapshot since the last one |
| Removed | Violations removed since the last one |
| #Critical / #Violations | The violation count for the selected item. This is also the default sort |
| Previous or Evolution | The percentage change against the previous snapshot |
| Weight | How much the item counts towards its parent. Higher means it matters more |
| Critical Rule | A red dot marks a rule set as critical in the assessment model |
Columns on the violation list
| Column | Meaning |
|---|---|
| Object Name Location | The object’s name and, for file-based objects, its location on disk |
| Risk | Previously the Propagated Risk Index (PRI). Identifies the violations that reach the most components and the objects carrying the most violations for the Health Measure in question |
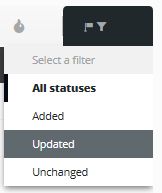
| Status | How the object changed since the previous snapshot: Added, Updated, Deleted or Unchanged. Filter on it from the column header |
Risk is calculated as (RPF + 1) x VI:
- RPF, the Risk Propagation Factor, is how far a violation reaches. For a Robustness, Performance or Security violation it is the size of the call path; for a Changeability violation it is the fan-in; for a Transferability violation it is zero.
- VI, the Violation Index, weights the violations an object carries. For each rule the object violates that contributes to the Health Measure, the rule’s weight within its technical criterion is multiplied by that criterion’s weight within the Health Measure, and the results are summed.
Selecting one or more violations enables the Add / Manage menu, which adds them to the Action Plan or the scheduled exclusion list. An icon on the row shows an item already added to either. Doing this requires the Quality Manager or Exclusion Manager role - see User permissions.
An icon on each row also jumps straight to that object in Application investigation.
How rows are ordered and greyed out
Rows are sorted worst first, by violation count in the current snapshot; ties are broken by the Previous or Evolution value.
| What you see | Why |
|---|---|
| A greyed-out row | The item has no violations, so there is nothing to remediate. It can still be opened |
0.00% variation, greyed out |
Either there is no previous snapshot to compare against, or nothing changed |
~ before a variation |
The variation rounds to 0.00 but is not exactly zero |
N/A |
Either there is only one snapshot, so no comparison is possible, or the item is a distribution or measure and has no objects in violation |
new in the Evolution column |
The rule was not violated in the previous snapshot. Never shown when only one snapshot exists |
Where the Previous percentage matches the Baseline percentage, the previous and baseline snapshots are the same one, which happens when only one or two snapshots exist.
Narrowing what you see
The whole application is in scope by default. Filters in the breadcrumb area at the top right narrow it:
Assessment model. The AIP Assessment Model is used by default. Industry standard extensions - CISQ, MIPS Reduction, OMG-ASCQM, OWASP - each add their own model:
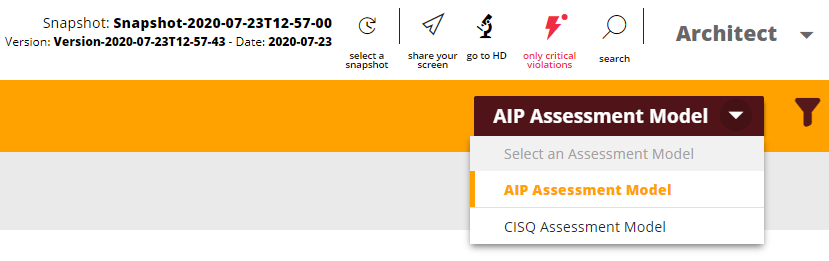
Switching from the AIP Assessment Model to an industry standard model disables the critical violations filter, and non-critical violation information is shown.
Modules. Restricts results to one module, with a search field for finding it:
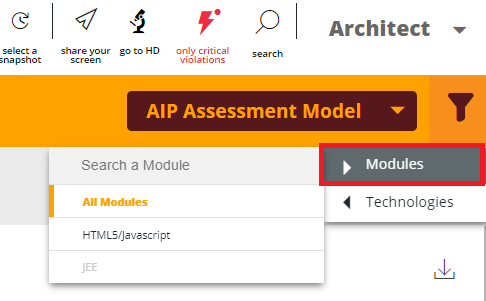
Note that a technical criterion or rule may not apply to a given module at all - a SQL rule has no meaning for a module containing no SQL - so filtering to that module while such a rule is selected returns nothing useful.
Technology. Restricts results to one technology.
Comparing snapshots with care
Results move between snapshots for two different reasons, and only one of them is about your code.
Changes to the CAST measurement system - analyzers, extensions, rules, the default assessment model - also shift the numbers. Changing a rule from critical to non-critical between snapshots will change the cumulative results of every parent technical criterion and Health Measure, without a line of source code having changed.
Treat trend and comparison data as reliable only insofar as you know what happened to the measurement system between the two snapshots.