Engineering and Security Dashboard tiles
Overview
The home page of the Engineering and Security dashboards is a grid of tiles, and every tile is an entry in the panels array of that dashboard’s configuration file - config/ed/ed.json for Engineering, config/sd/ed.json for Security.
This page is the reference for what those entries can contain. See Tile customization for locating and editing the files, and Configuration options for the settings that affect the whole interface rather than one tile. The Management Dashboard uses an entirely different set of tiles - see Management tiles.
Change color and title and move a tile or two before attempting anything larger, and keep a copy of the working file. A malformed .json stops the dashboard reading its configuration at all.
For what each tile shows an end user, see the Engineering Dashboard home page.
Every tile takes these
| Property | Purpose |
|---|---|
type |
Which tile this is. The values are listed in Tile types and are case-sensitive |
parameters |
The type-specific settings. Some types take none, in which case {} |
color |
The tile’s colour |
title |
An optional label, used by the types that do not derive one |
id |
An optional identifier for the tile |
col, row, sizex, sizey, min-*, max-* |
Position and size - see below |
Position and size
The home page is a fixed grid of columns and rows, and each tile declares where it sits and how far it may be stretched:
| Property | Meaning |
|---|---|
col |
The column holding the tile’s upper left corner |
row |
The row holding the tile’s upper left corner |
sizex |
Width, in columns |
sizey |
Height, in rows |
min-sizex, min-sizey |
The smallest a user may drag the tile |
max-sizex, max-sizey |
The largest a user may drag the tile |
Users can move and resize tiles themselves, but those changes live in their browser. Reset homepage returns everything to the values set here, which makes this file the real default rather than a starting suggestion.
Health Measure ids
Several tile types take a business parameter naming a Health Measure by id:
| Id | Health Measure |
|---|---|
60011 |
Transferability |
60012 |
Changeability |
60013 |
Robustness |
60016 |
Security |
60017 |
Total Quality Index |
The complete set your installation recognises is listed in the IndustryStandardsKeys block of the same file, which also gives the ids for the CISQ and ISO-5055 equivalents.
Tile types
type |
Tile | Provided by default |
|---|---|---|
QualityModelOverview |
Risk Model | Yes |
ComponentInvestigationOverview |
Application Components | Yes |
AddedViolations |
Risk Introduced | Yes |
BusinessCriteria |
Health Measure weakness and strength | Yes |
RiskiestComponents |
Top Riskiest Components | Yes |
TopRiskiestTransactions |
Top Riskiest Transactions | Yes |
TopCriticalModules |
Top Modules with Violations | Yes |
NewViolationsForQualityRules |
Top Rules with increasing or decreasing violations | Yes |
Technologies |
Technologies Overview | Yes |
ActionPlanSummary |
Action Plan | Yes |
ExclusionSummary |
Exclusions | Yes |
ContinuousImprovement |
Continuous Improvement | Yes |
OMGTechnicalDebt |
OMG Technical Debt | Yes |
IndustryStandards |
An industry standard’s violation count | Configure manually |
ArchitectureModel |
Architecture Model Violations | Configure manually |
QualityStandards |
A quality standard or custom tag’s violation count | Configure manually |
ExternalLink |
A link to somewhere outside the dashboard | Configure manually |
BackgroundFactOverView |
A single Background Fact metric | Configure manually |
MockTile |
A blank separator | Configure manually |
QualityModelOverview
The Risk Model tile. Takes no parameters.
ComponentInvestigationOverview
The Application Components tile. Takes metric, the id of the lines-of-code measure to report.
{ "type": "ComponentInvestigationOverview", "parameters": { "metric": 66071 }, "color": "mauve" }
| Metric | Produced by |
|---|---|
66071 |
CAST Imaging during application onboarding, and used consistently across CAST Imaging components |
10151 |
CAST Imaging Core during the analysis, and used only by the Engineering Dashboard |
CAST recommends 66071 when running the dashboards with CAST Imaging 3.0 or later. Note that shipped ed.json files have been seen configured with 10151, so check which your installation uses before assuming the figure on the tile matches the one in the Management Dashboard.
AddedViolations
The Risk Introduced tile. Takes business, the Health Measure it reports on.
{ "type": "AddedViolations", "parameters": { "business": "60017" }, "color": "orange" }
BusinessCriteria
A Health Measure weakness or strength tile. Takes business, indicator naming it, and orderBy of weakness or strength. Two tiles differing only in orderBy give the pair seen out of the box.
{ "type": "BusinessCriteria",
  "parameters": { "business": "60012", "indicator": "Changeability", "orderBy": "strength" },
  "color": "green" }
threshold may also be supplied as an array of grade boundaries.
RiskiestComponents
The Top Riskiest Components cloud. Takes business, indicator, and optionally nbRows for how many objects to fetch - 10 by default.
{ "type": "RiskiestComponents",
  "parameters": { "business": "60011", "indicator": "Transferability", "nbRows": 10 },
  "color": "grey" }
TopRiskiestTransactions
The Top Riskiest Transactions cloud. Takes business as the starting Health Measure, and optionally nbRows - 30 by default.
TopCriticalModules
The Top Modules with Violations tile. Takes business.
NewViolationsForQualityRules
A Top Rules with increasing or decreasing violations tile. Takes business and variation:
variation |
Shows |
|---|---|
ratio |
The percentage difference against the previous snapshot. The default |
added |
The number of violations added |
removed |
The number of violations removed |
The ratio figure can differ from the added or removed count for the same rule, because it is a net difference and takes both additions and removals into account.
Technologies
The Technologies Overview tile. Takes business, indicator, and a threshold array of grade boundaries.
ActionPlanSummary
The Action Plan tile. Takes no parameters.
ExclusionSummary
The Exclusions tile, reporting active and scheduled counts. Takes no parameters.
ContinuousImprovement
The Continuous Improvement tile. Takes no parameters.
OMGTechnicalDebt
Reports total, added and removed OMG technical debt in days. Requires the OMG Technical Debt extension; without it the tile shows N/A.
business selects which index the figure is based on:
business |
Based on | Requires |
|---|---|---|
1061000 |
The ISO-5055 index | Extension 2.x or later |
60017 |
Total Quality Index, from CAST Imaging Core | Extension 2.x or later |
1062100 |
The CISQ index | Any release, plus the CISQ Index extension |
IndustryStandards
Reports the violation count for one industry standard. Takes title, the id of the Business Criterion, and an optional description which is not displayed.
{ "type": "IndustryStandards",
  "parameters": { "title": "CISQ", "id": "1062100" },
  "color": "green" }
Data comes from the CISQ, MIPS Reduction, ISO-5055 and OWASP extensions. The tile shows N/A and cannot be clicked where the application has no data for that standard. Clicking it opens Risk investigation with the standard selected.
ArchitectureModel
Lists the architecture models assigned to the application and checked during the snapshot, with a violation count each. Takes business, which must be 60017, and criticalsRulesOnly:
criticalsRulesOnly |
Shows |
|---|---|
true |
Critical violations only |
false |
Non-critical violations |
An architecture model is itself either critical or non-critical, so all of its violations fall on one side.
QualityStandards
Reports the violation count for rules carrying a quality standard tag or a custom tag. Takes title, id naming the tag, and an optional description.
{ "type": "QualityStandards",
  "parameters": { "title": "CISQ Reliability", "id": "CISQ-RELIABILITY", "description": "violations" },
  "color": "blue" }
Quality standard tags require the Quality Standards Mapping extension installed before the snapshot was generated. Clicking the tile opens Risk investigation with that tag selected, All Rules chosen, and only the tagged rules listed.
ExternalLink
A tile that leads somewhere outside the dashboard. Takes title for the text shown and url for the destination.
{ "type": "ExternalLink",
  "parameters": { "title": "Know more about CAST", "url": "http://www.castsoftware.com" },
  "color": "magenta" }
BackgroundFactOverView
Reports one Background Fact metric uploaded during snapshot generation. Takes backgroundFactId and title. Long titles are truncated.
{ "type": "BackgroundFactOverView",
  "parameters": { "backgroundFactId": 66006, "title": "Business Value" },
  "color": "eco-green" }
MockTile
A blank tile used to separate groups of tiles. It cannot be clicked through to anything. Give it an empty color and a title if you want a heading:
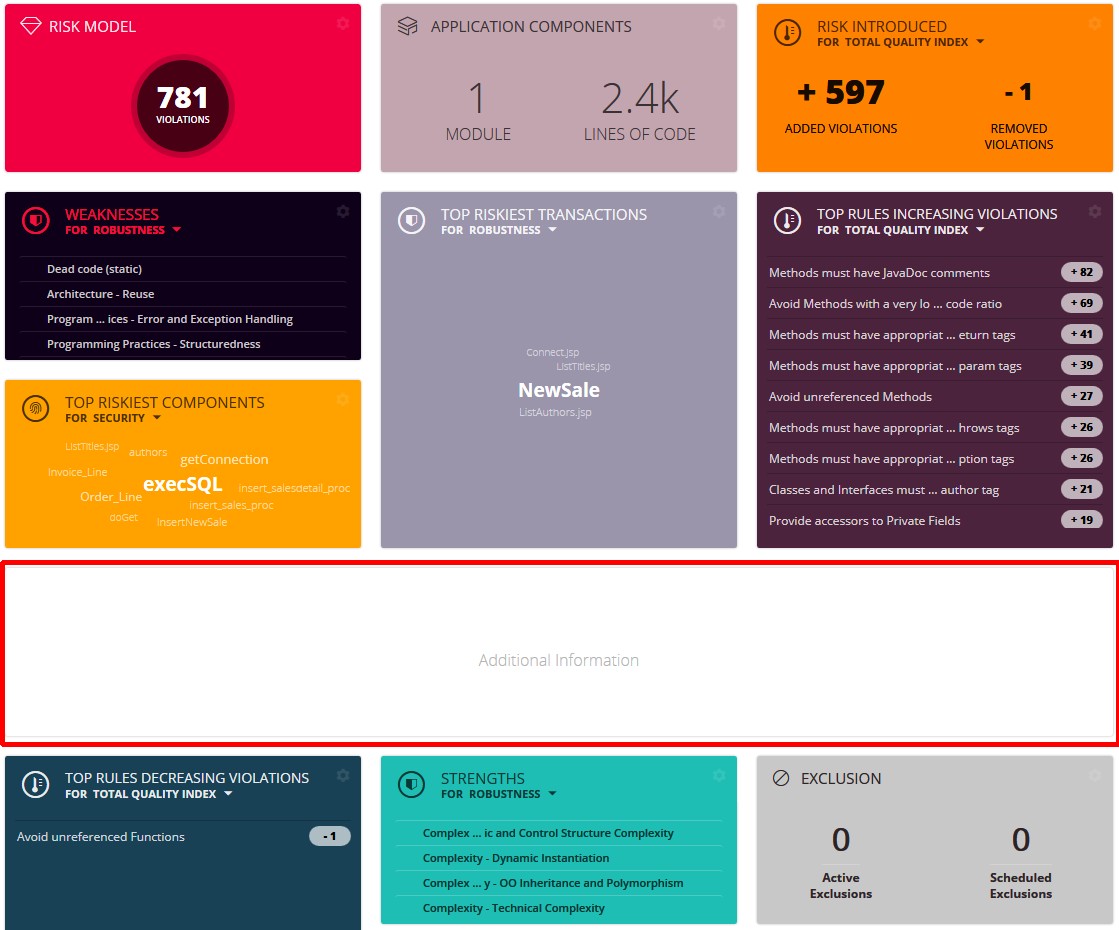
{ "type": "MockTile", "color": "", "parameters": {},
  "col": 1, "row": 5, "sizex": 6, "sizey": 1,
  "max-sizex": 8, "max-sizey": 6, "title": "Additional Information" }