In-dashboard reports
Overview
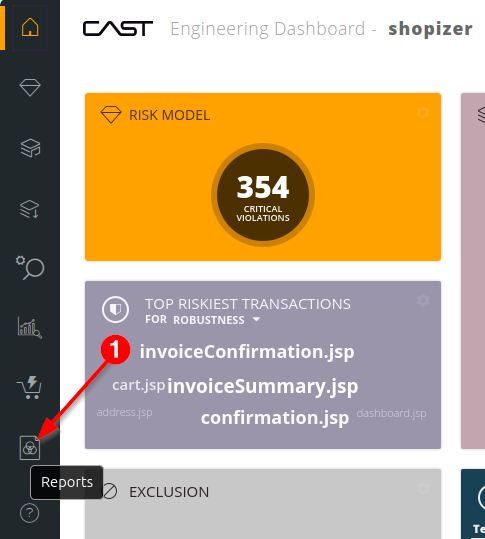
The Engineering Dashboard generates reports on the fly, without any separate tool. Reach the feature from the sidebar’s report icon:
Two report categories are available, both enabled out of the box and neither requiring configuration:
| Category | Answers | Output |
|---|---|---|
| Standard Compliance | How does this application measure against an industry standard? | |
| Miscellaneous | Where have violations moved most between snapshots? | Inline, downloadable as Excel |
This is not the same thing as Report Generator, which is a separate tool building documents from Microsoft Office templates you control, and which can report across a portfolio. Use the in-dashboard reports for a quick view of the application in front of you; use Report Generator when you need a repeatable document in a company format.
Standard Compliance reports
Reports against recognised industry standards, generated as PDF. Most come in two forms: a Compliance report summarising the position, and a Detailed report listing the violations behind it.
| Standard | Editions offered |
|---|---|
| ISO-5055 | Compliance and Detailed, plus variants carrying OMG Technical Debt |
| CWE | The full CWE set, and Top 25 for 2011, 2019, 2020, 2021, 2022, 2023 and 2024 |
| OWASP | 2013, 2017 and 2021 |
| OWASP API | 2019 and 2023 |
| OWASP Mobile | 2016 |
| PCI-DSS | V3.1, V3.2.1 and V4 |
| NIST | SP800-53R4 |
| STIG | V5 and V6 |
| C-CPP | Standards Compliance and Detailed |
The exact list is defined in ed.json and can be trimmed by an administrator - see Report categories.
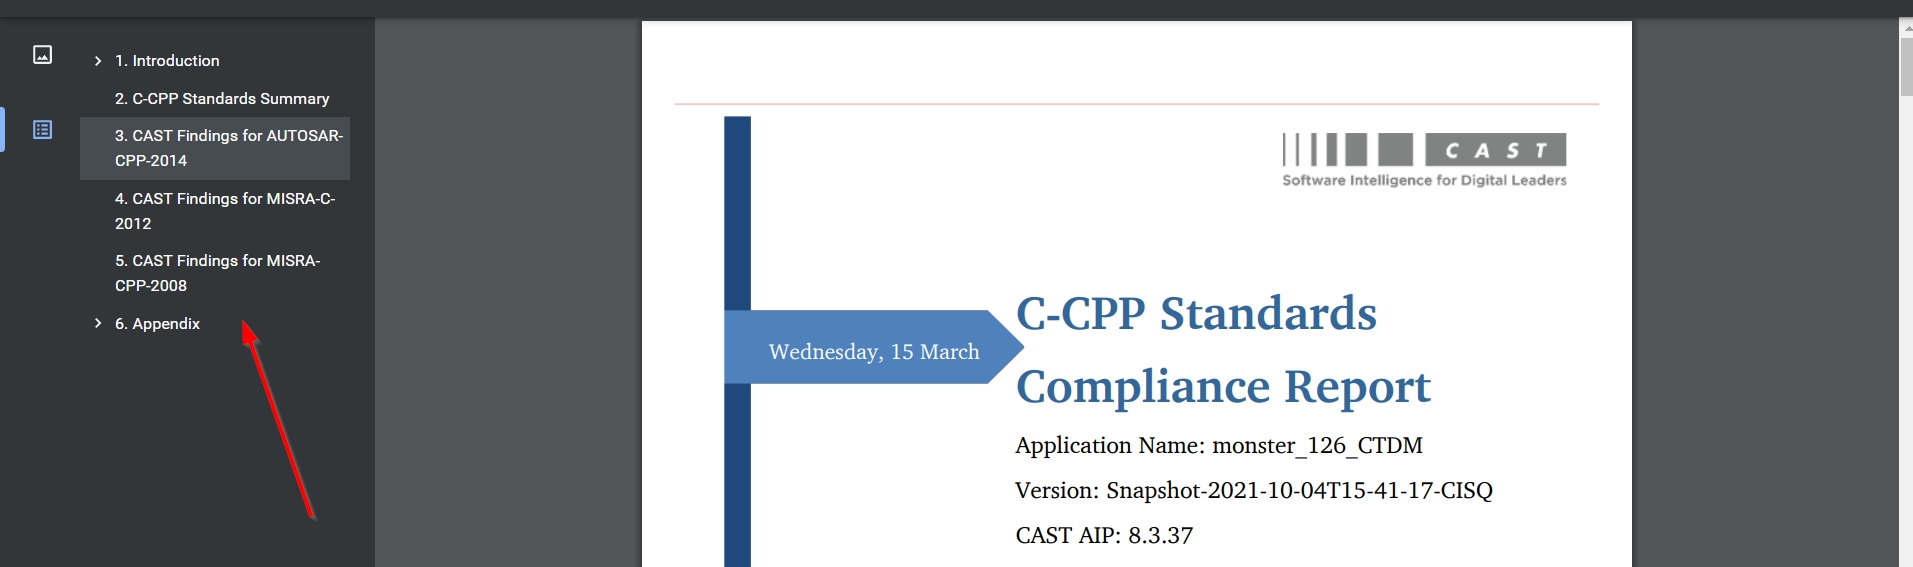
The PDFs carry chapter bookmarks for navigation:
Report templates are .json files held in the config/reports folder of the dashboard’s data location.
Miscellaneous reports
These show where the biggest changes in violations between snapshots have occurred, rendered inline in the browser:
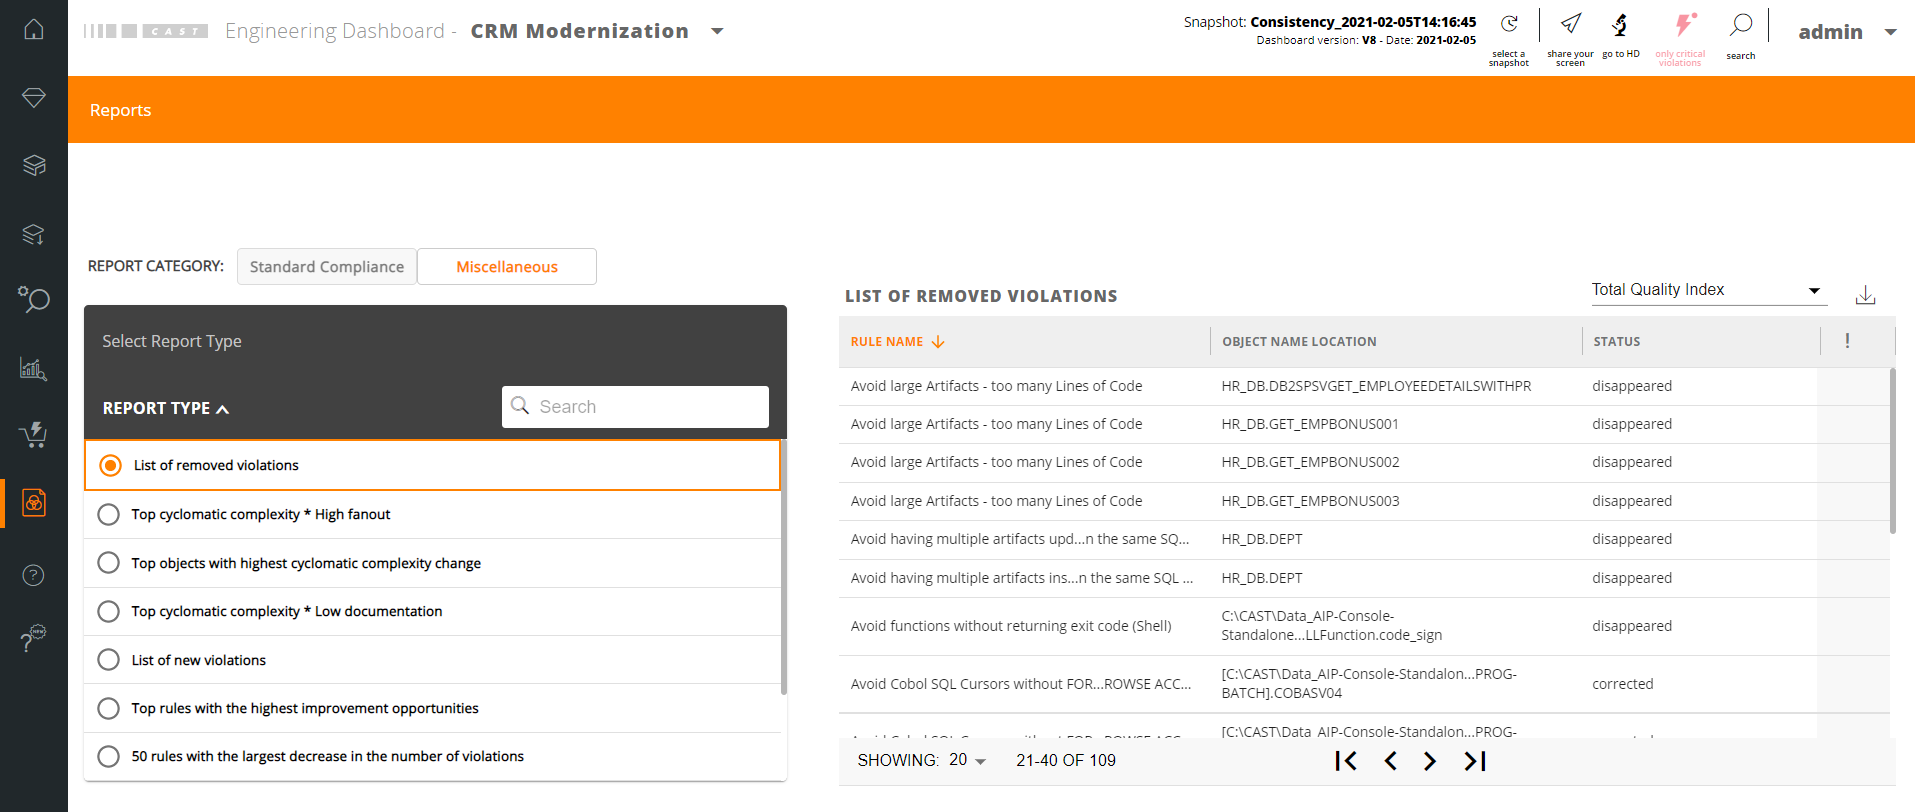
Report types can be sorted and searched. Where there are many violations, a search button filters on the object name and location.
Options
Filter on Health Measure. Some reports can be scoped to one Health Measure. TQI is active by default:
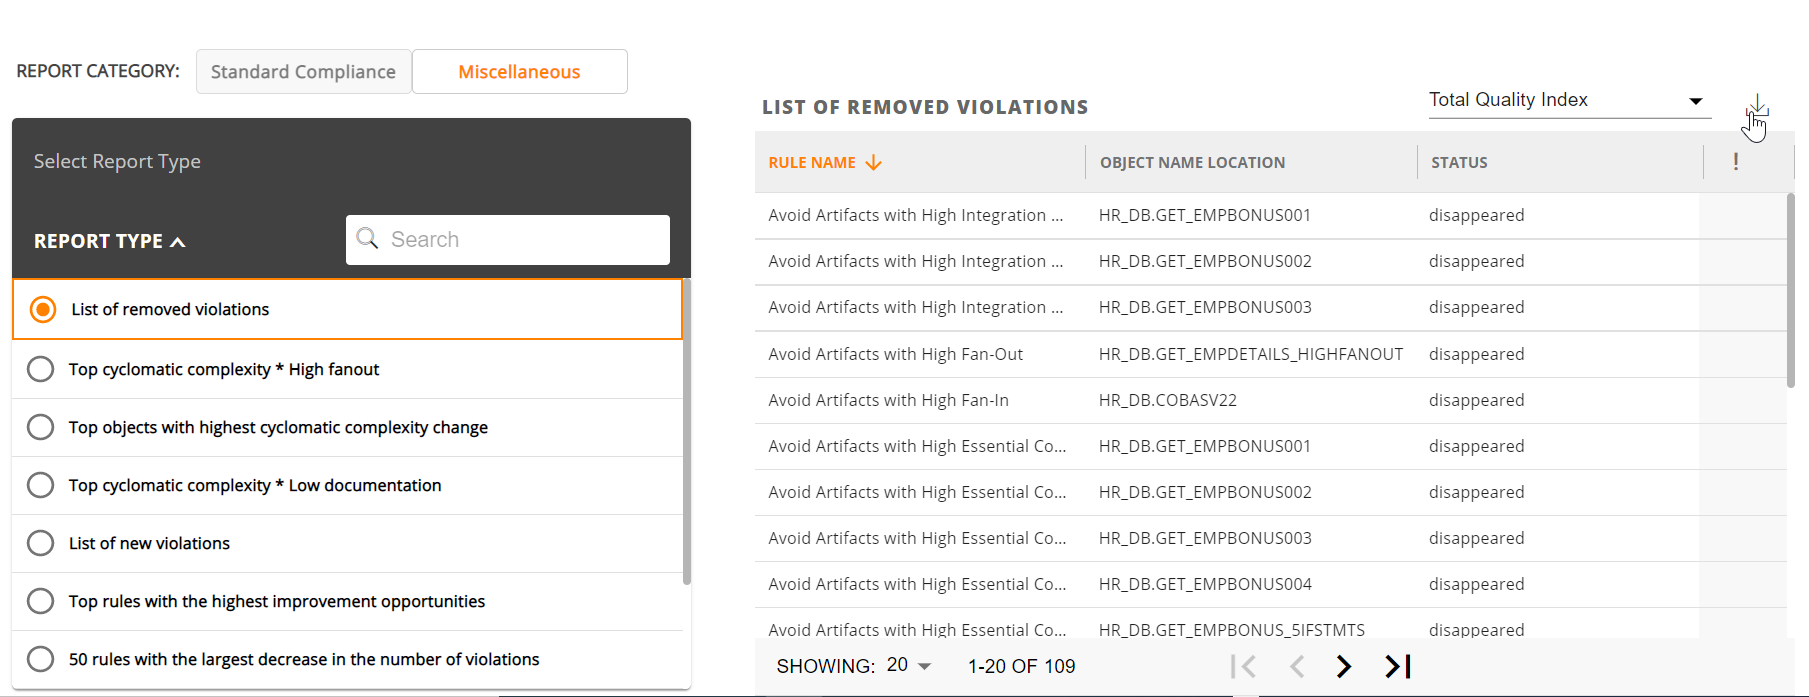
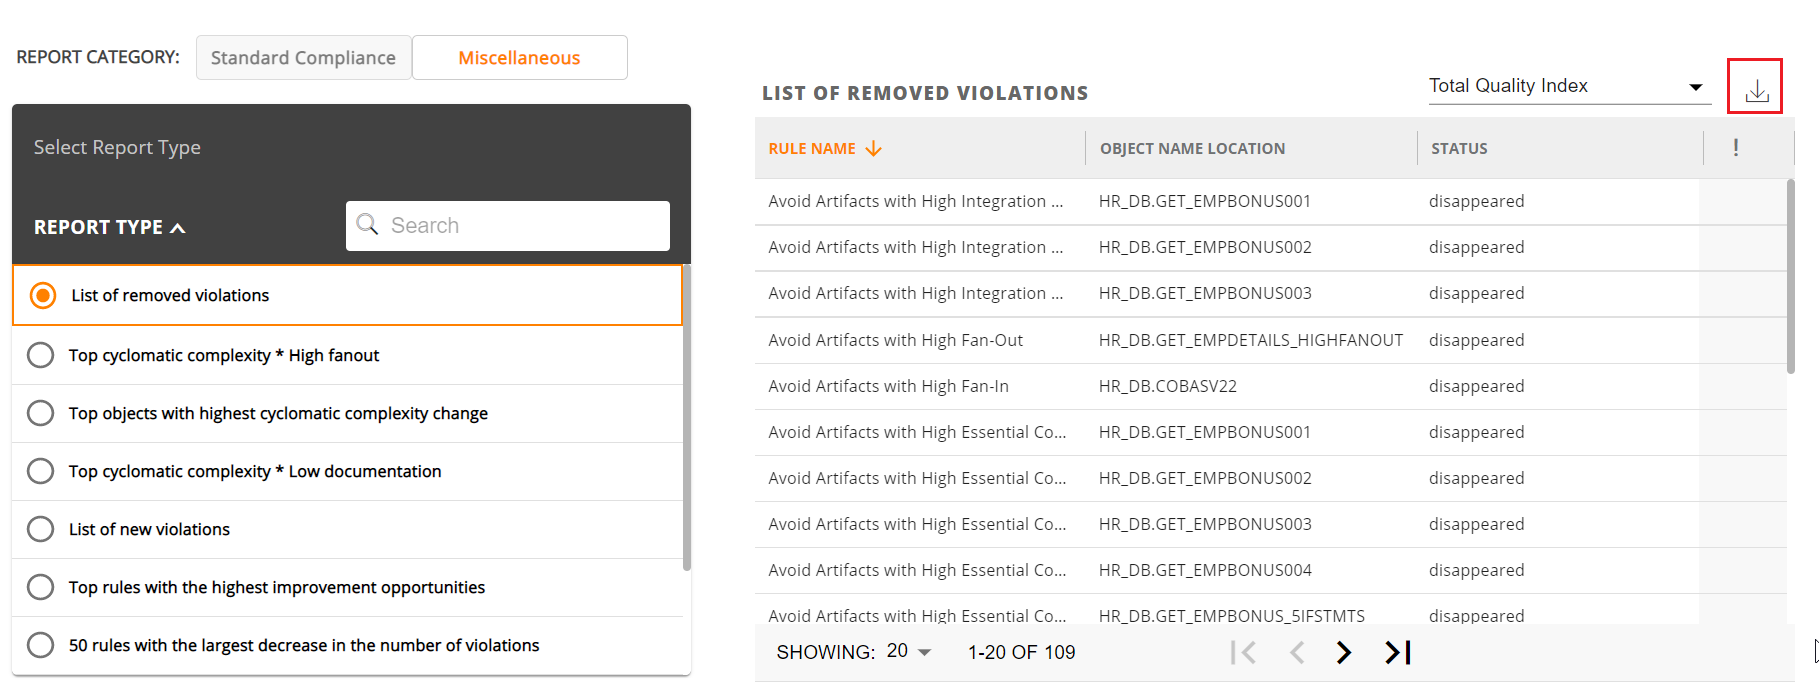
Download. Results can be exported to Excel:
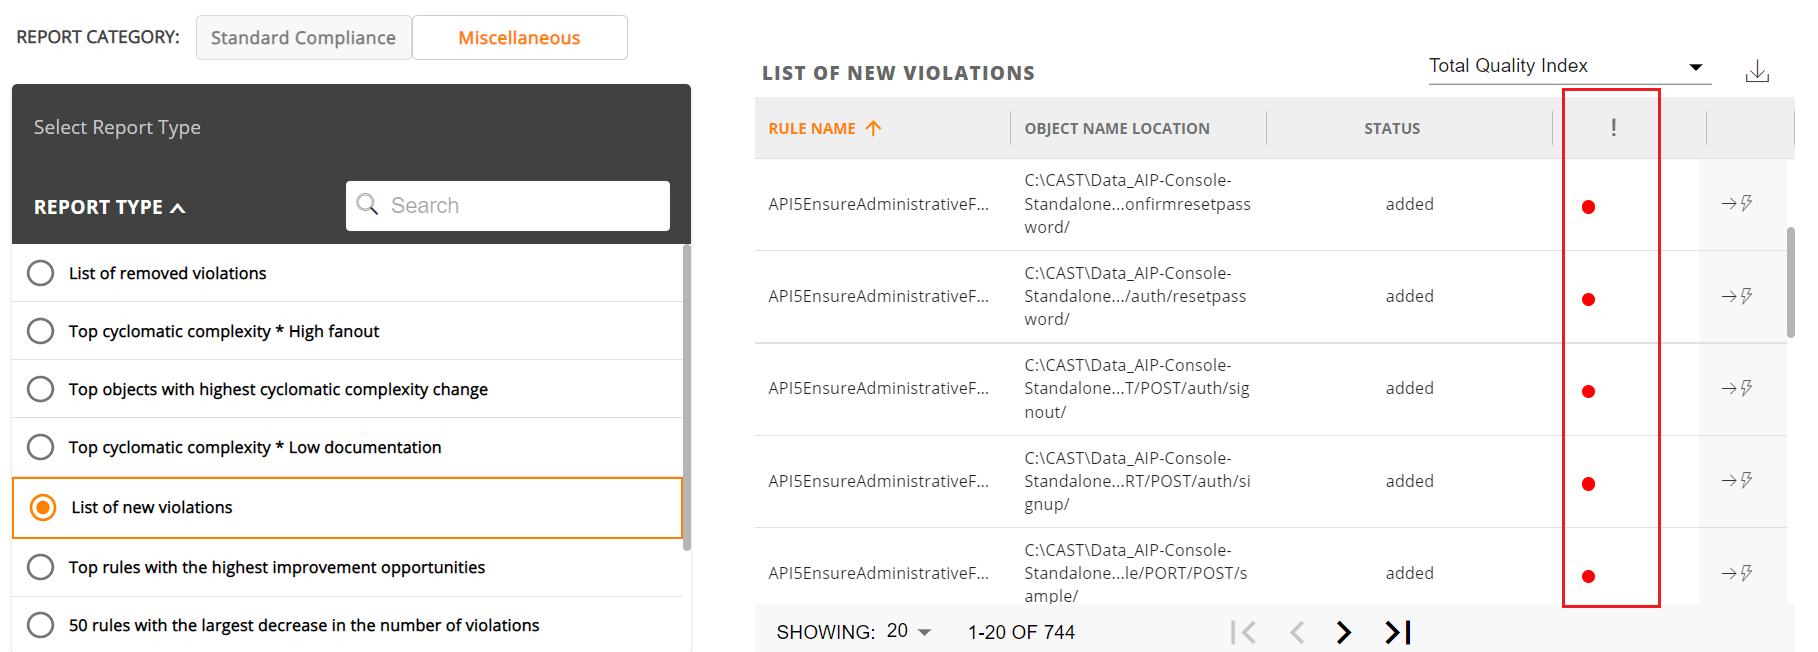
Critical flag. Marks whether the related rule is critical:
Drill down. Where the report supports it, you can open a violation’s source code, or open the object in Application investigation.
The improvement gap
The report Top rules with the highest improvement opportunities ranks rules by a calculated gap:
Improvement Gap = (rule weight x technical criterion weight) x (4 - grade)
So a heavily weighted rule with a poor grade rises to the top: it is where effort buys the most.
Report language
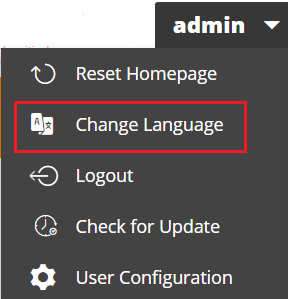
Reports can be generated in German, Italian, Spanish, French and Chinese. Set the dashboard language first via Change Language in the user menu, then generate the report - see Changing the display language. Some items in the report will then appear in that language: