Security Dashboard
Overview
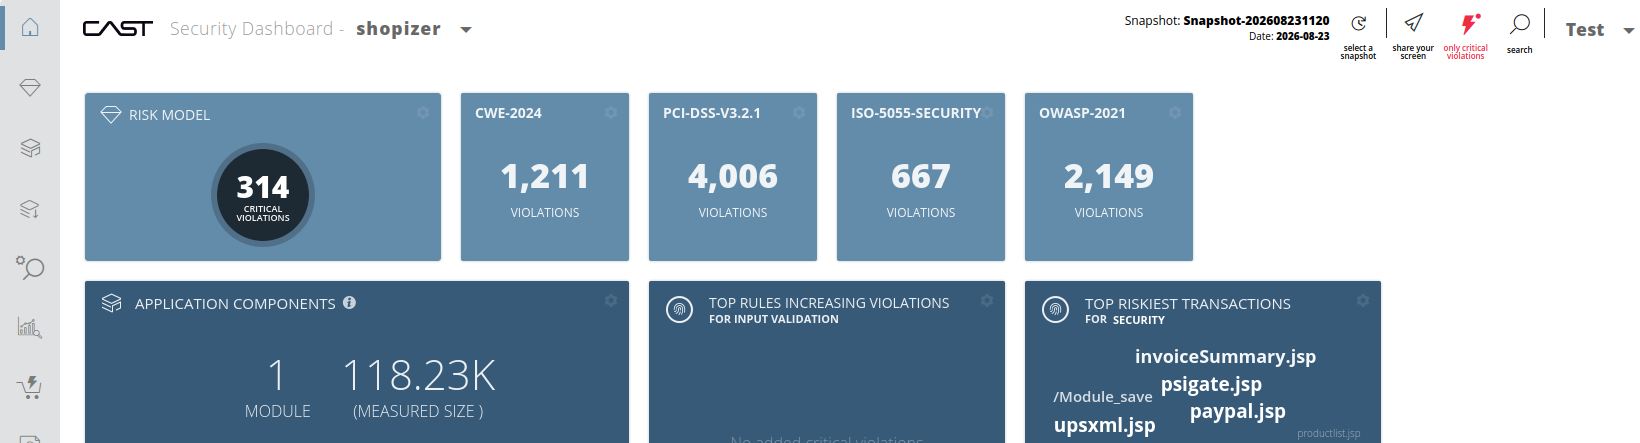
The Security Dashboard is the Engineering Dashboard pointed at security. It is the same interface, working on the same snapshot, with the same investigation views and the same tools for acting on what you find - but its home page leads with industry security standards, and its assessment model is scoped to security rules.
If you have not opened a dashboard before, start with Prerequisites, which covers the component, the license and the permissions you need.
Results appear on their own: publishing to the dashboards is a step in the analysis, so a completed deep analysis makes the application and its new snapshot available here without anyone doing anything. If results you are expecting are missing, the dashboards read from a server-side cache that may need reloading - ask an administrator, and see Reloading the dashboard cache.
Open it from the application in the landing page and choose View Security Dashboard. As with Engineering, you arrive already pointed at that application.
What is different here
Only three things genuinely differ from the Engineering Dashboard:
| Difference | Where |
|---|---|
| The home page leads with CWE, PCI-DSS, ISO-5055 Security and OWASP tiles rather than quality tiles | The home page |
| A configurable Automated Technical Debt tile drills into the CISQ assessment model and adds a Technical Debt (OMG) view | Risk investigation |
| Reports cover security and industry compliance standards | Reports |
There is no Architecture Model in the Security Dashboard. Everything else - the drill-down, the source code view, the action plan, exclusions, education, continuous improvement, search and export - behaves exactly as it does in Engineering.
Everything else is the Engineering guide
Rather than repeat it, these are the Engineering pages. They apply unchanged, with the assessment model scoped to security:
| To do this | See |
|---|---|
| Drill from a Health Measure to the violating objects and their source code | Risk investigation |
| Work from the application’s objects outwards | Application investigation |
| Find the riskiest transactions | Transaction investigation |
| Build a list of violations to fix | Action plan |
| Take irrelevant violations out of future snapshots | Exclusions |
| Track rules a team should learn from | Education |
| See how those rules have moved over snapshots | Continuous improvement |
| Search for rules, objects or violations | Search |
| Export a table to Excel | Exporting data |
The critical violations filter applies here too, and changes every count on the page.
The limited access message
The Security Dashboard is licensed on the number of authorized users. Where too many users are authorized, every page carries this message:
There are too many authorized users to connect to your Security Dashboard.
To avoid this limitation, you can contact your CAST Project Manager to
update your licensing terms and conditions.
The CAST Project Manager text is a link, and clicking it opens an email in your local mail client requesting a license update. Contact your CAST administrator to have the license updated.
Guides
The security standard tiles, what each counts, and how the critical violations filter changes them.
What the security-scoped assessment model changes, and the Automated Technical Debt tile.
Security and Industry Compliance reports as PDF, and Miscellaneous reports.