Risk investigation in the Security Dashboard
Overview
Risk investigation works exactly as it does in the Engineering Dashboard: you select a Health Measure, narrow to a technical criterion, narrow again to a rule, and end at the violating objects with their source code. The drill-down, the table columns, the display rules, the filters and the source code view are all the same.
Read Risk investigation for the mechanics. This page covers only what the Security Dashboard adds or omits.
What is scoped differently
The assessment model here is scoped to security, so the Health Measures, technical criteria and rules you drill through are the security ones. The Assessment Model filter still offers the industry standard models where their extensions are installed - CISQ, MIPS Reduction, OMG-ASCQM and OWASP.
Switching from the default model to an industry standard model disables the critical violations filter and shows non-critical violation information, exactly as in Engineering.
What is missing
There is no Architecture Model section. In the Engineering Dashboard a rule carrying architecture model data draws the model as an interactive diagram of permitted and forbidden layer dependencies; the Security Dashboard has no equivalent.
The Automated Technical Debt tile
This is the one thing risk investigation here has that Engineering’s does not.
An Automated Technical Debt tile can be configured to show the total OMG technical debt added and removed, and the total in days:
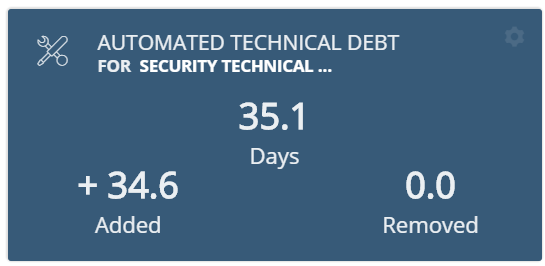
It is not provided out of the box and has to be configured by an administrator - see OMGTechnicalDebt.
What it opens
Clicking the tile drills into risk investigation with the CISQ assessment model selected and the view set to Technical Debt (OMG):
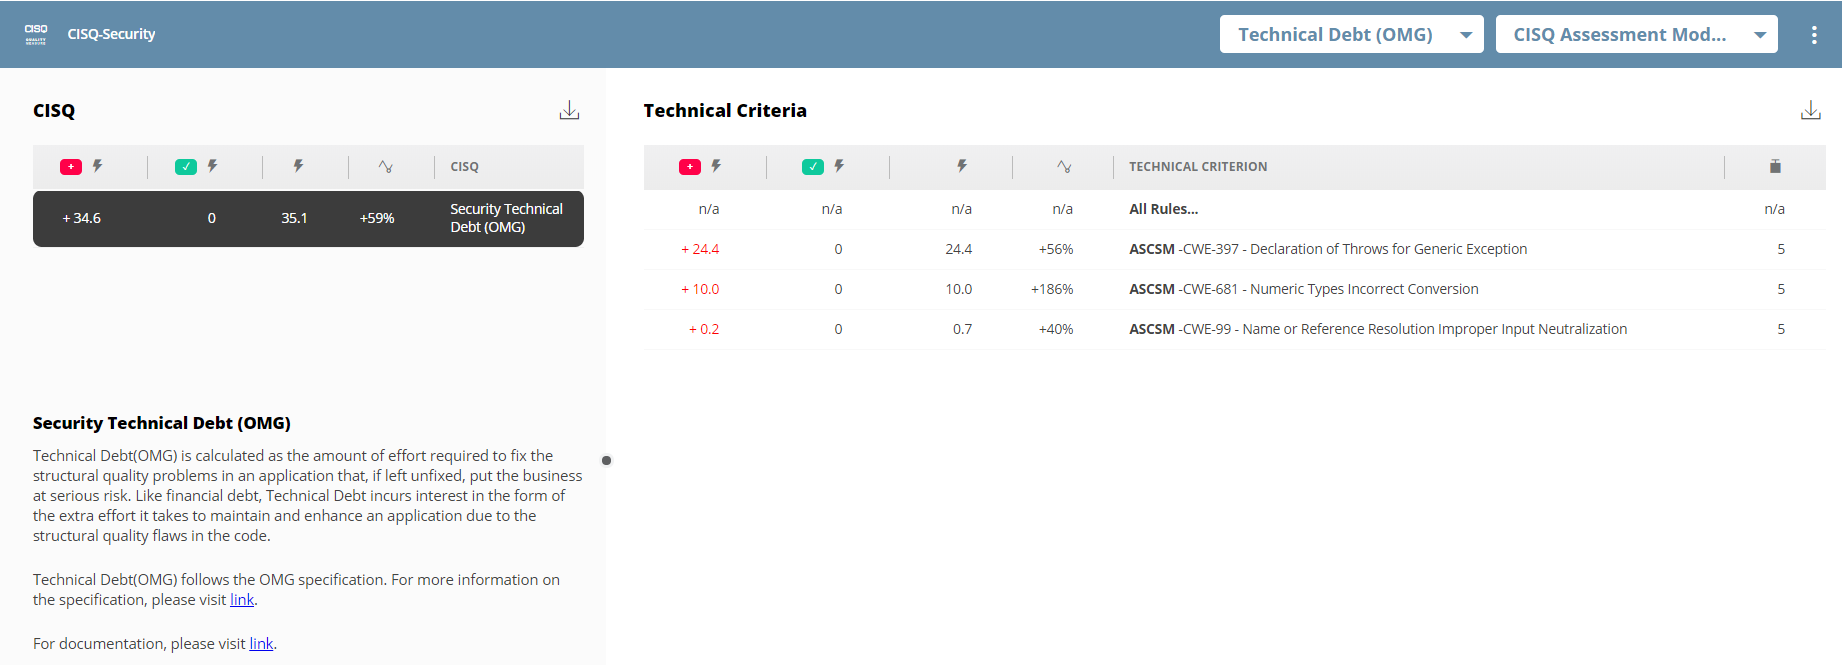
You can switch to the CISQ assessment model violation view from the drop-down.
The Technical Debt (OMG) sections it adds
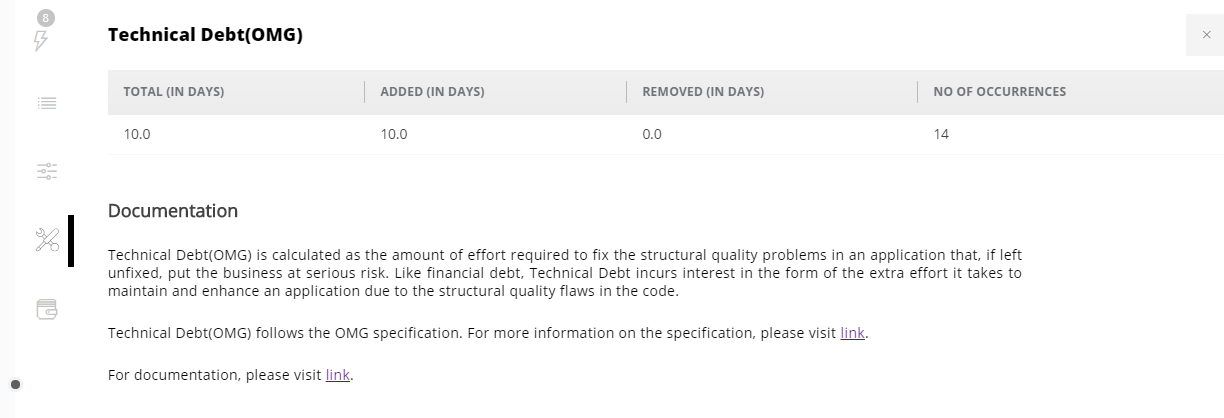
In Rule Details, a Technical Debt (OMG) section reports the total, added and removed debt for the rule, and the number of occurrences:
In the source code view, a second icon appears alongside Source Code. Clicking it scrolls to a Technical Debt (OMG) section carrying the object-level figures: Adjustment Factor, Unadjusted Effort (in mins) and Adjusted Effort (in mins):
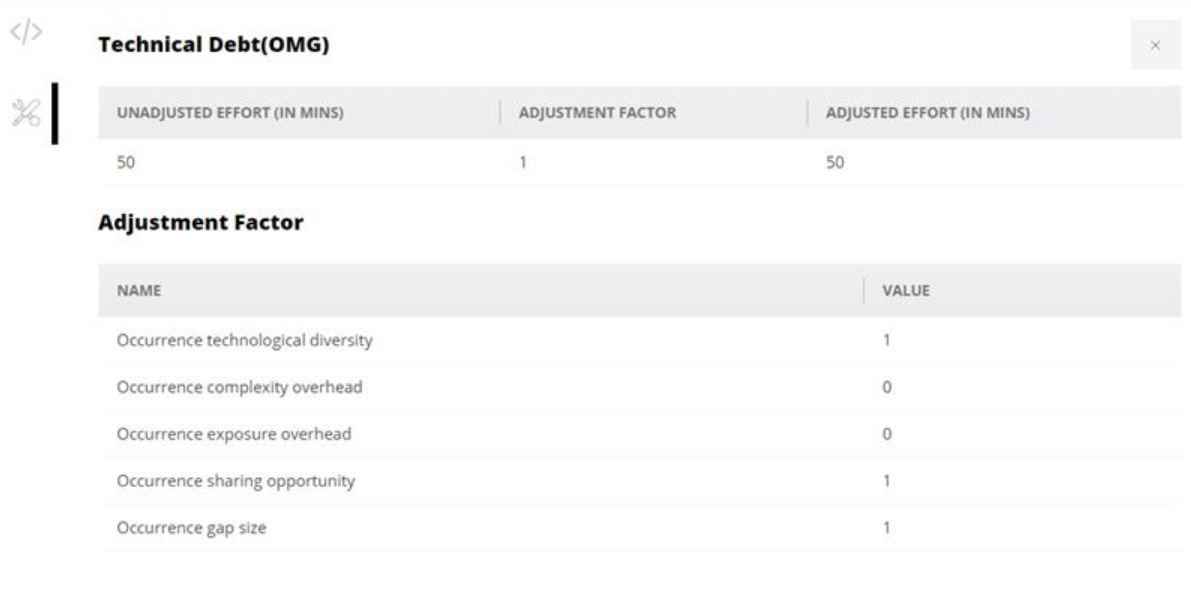
These are OMG Technical Debt figures, adjusted per object for its characteristics. They are not the same as the estimates the action plan recommendation uses, which are averaged for speed and cover all rules rather than CISQ only.