Engineering Dashboard
Overview
The Engineering Dashboard is where you go from “this application has a problem” to “this object, on this line, breaks this rule”. It works on one application at a time, reading the snapshot produced by an analysis, and offers three ways in to the same data depending on what you already know.
If you have not opened a dashboard before, start with Prerequisites, which covers the component, the license and the permissions you need.
Results appear on their own: publishing to the dashboards is a step in the analysis, so a completed deep analysis makes the application and its new snapshot available here without anyone doing anything. If results you are expecting are missing, the dashboards read from a server-side cache that may need reloading - ask an administrator, and see Reloading the dashboard cache.
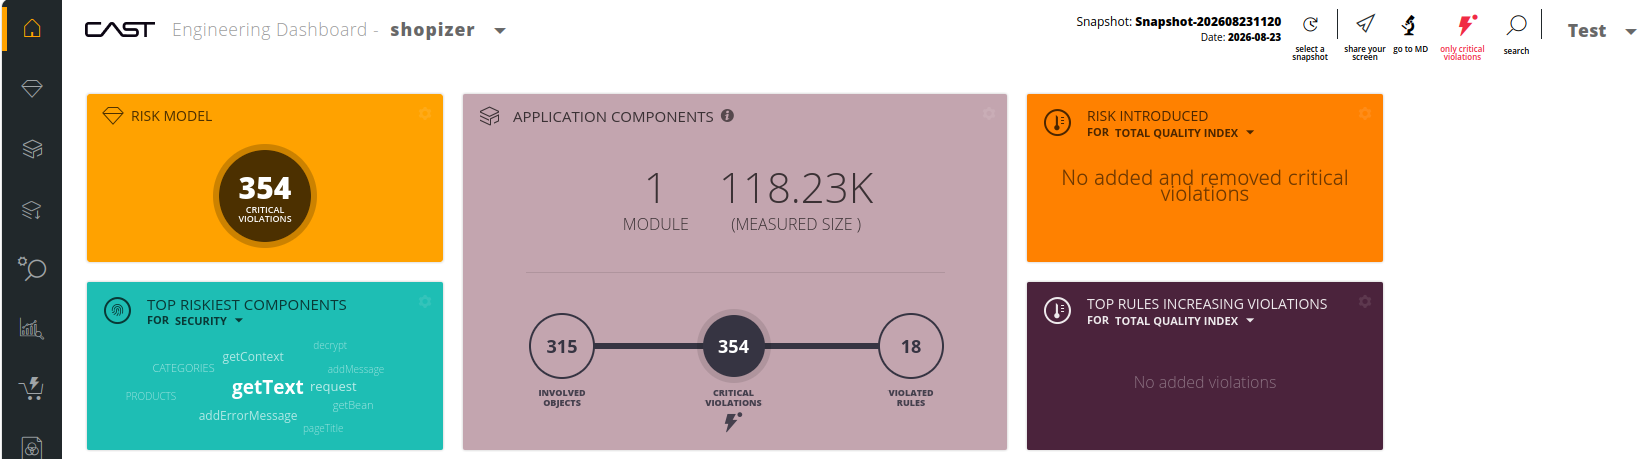
Three ways to investigate
| View | Start here when you want to know | Perspective |
|---|---|---|
| Risk investigation | Which rules are failing, and how badly | The assessment model: Health Measures, technical criteria, rules |
| Application investigation | Which objects are at fault, and what they depend on | The application’s technical components |
| Transaction investigation | Which end-to-end transactions carry the most risk | The application’s transactions |
All three end in the same place - a list of violating objects with their source code - but they get there from different directions.
Getting to an application
The Engineering Dashboard always works on one application at a time, and you arrive already pointed at it. Open the application in the landing page and choose View Engineering Dashboard: the dashboard opens on that application’s home page.
There is no intermediate “which application?” step, however many applications you are authorized to see. Once you are in the dashboard, the application selector in the top menu bar switches to any other application you are authorized to view.
The critical violations filter
This is the single most important thing to understand about the Engineering Dashboard, because it changes every number you see.
By default the dashboard shows only critical violations. A violation is critical when the rule it breaks is marked critical in the quality model used for the analysis. The filter icon in the top menu bar is red while this default is active. Turning the filter off shows all violations, critical and not.

Almost everything responds to the filter. These do not:
- The Action Plan view
- The Top Riskiest Components tile
- The Top Riskiest Transactions tile
- The industry standard tiles - ISO-5055, CISQ, OWASP and MIPS - which always count non-critical violations
Two things worth knowing. Following a fixed URL to a non-critical rule temporarily disables the filter, and the dashboard tells you it has done so. Resetting the home page returns the filter to its default.
Looking at an earlier snapshot
The dashboard shows the most recent snapshot by default. The snapshot selector in the top menu bar lets you go back to an earlier one:
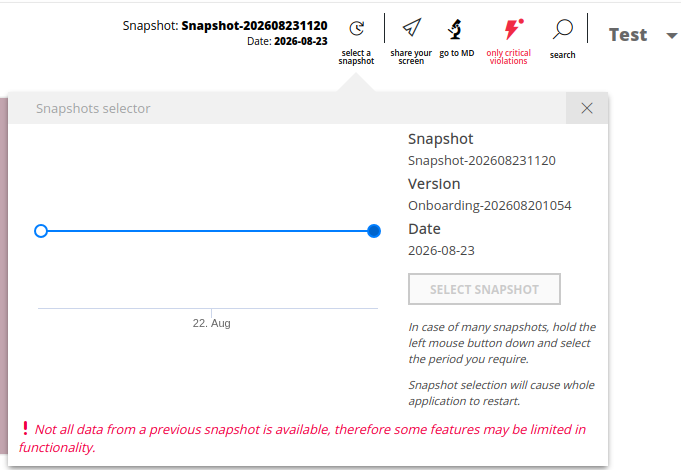
Not all data is historized, so some features are reduced or unavailable:
| Feature | In an earlier snapshot |
|---|---|
| Action Plan, Exclusions | Viewable, but cannot be changed. Editing is only possible on the most recent snapshot |
| Education, Continuous Improvement | Not available |
| Application investigation | Not available - the data is not historized |
| Source code | Not available |
| Application Components, Top Modules with Critical Violations, Top Riskiest Components tiles | Displayed faded, with a short explanation in place of the data |
Guides
The tiles on the application home page, what each one tells you, where clicking it leads, and how to rearrange, bookmark and recolour them.
Drill from a Health Measure down through technical criteria and rules to the violating objects, their source code and the reasoning behind each rule.
Work from the application’s objects outwards: which components violate what, and how they depend on each other.
Find the riskiest end-to-end transactions and the violations that make them risky.
Acting on what you find
Build a prioritised list of violations to fix and track whether they get fixed, or let the dashboard recommend a plan for a target grade.
Take irrelevant violations and false positives out of future snapshots, and understand the difference between scheduled and active.
Track rules a team should learn from, and optionally add their new violations to the action plan automatically.
See how violations of the rules on your education list have moved across successive snapshots.
Finding and extracting
Find rules and objects by name, or search violations across the whole snapshot with filters on criteria, weight, criticality, status, transactions, technologies and modules.
Generate Standard Compliance reports as PDF, and Miscellaneous reports showing where violations have moved most between snapshots.
Export any of the dashboard’s tables to Excel, and know what the file leaves out.