Application investigation
Overview
Application investigation approaches the application through its structure rather than its assessment model. You navigate the tree of modules, projects and objects, and for whatever you select the dashboard tells you which rules it violates. It is the view to use when you already know roughly where the problem is and want to know what is wrong there.
Reach it from the sidebar, or by clicking the Application Components tile:
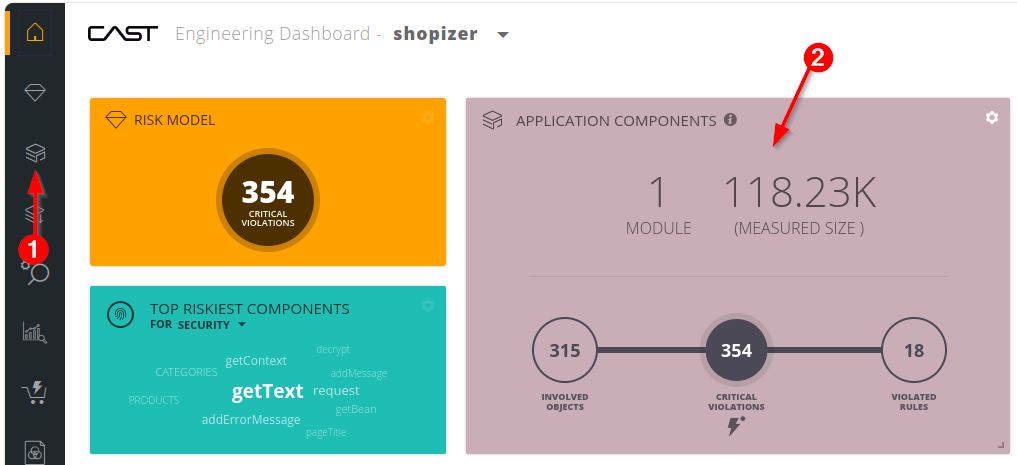
This view is not available when you are looking at an earlier snapshot, because the data behind it is not historized.
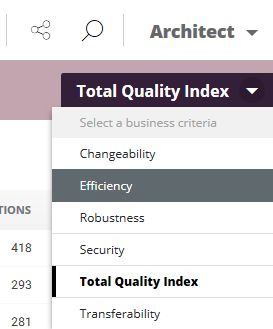
The view works against one Health Measure at a time. Total Quality Index is the default; change it from the selector in the top right:
The Application Browser
The browser is a hierarchical tree of the application, its modules, and the projects and objects within them:
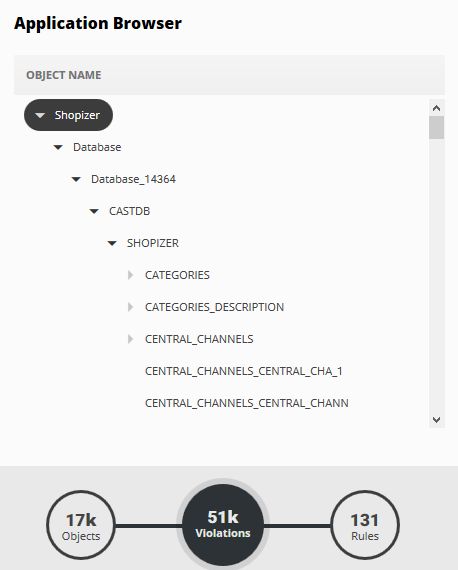
Selecting anything in the tree does two things.
- It updates the right-hand panel with the rules that item violates. Select the application at the root and you get every rule violated anywhere in it; select a single object and you get only that object’s rules.
- It also updates the three circular summaries beneath the tree:
| Summary | Counts |
|---|---|
| Objects | Objects that violate at least one rule, within the selected item |
| Critical Violations or Violations | Violations of rules within the selected item. Always equal to or greater than the Rules figure |
| Rules | Rules the selected item violates |
A large application with a flat project structure can contain a great many items. The browser loads about 100 at a time and fetches more as you scroll, showing “Loading Next Items” as it goes: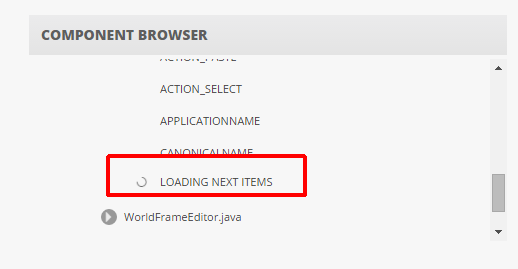
Rules for the selected item
Rules are listed by how many times the selected item violates them, with critical rules marked by a red dot:
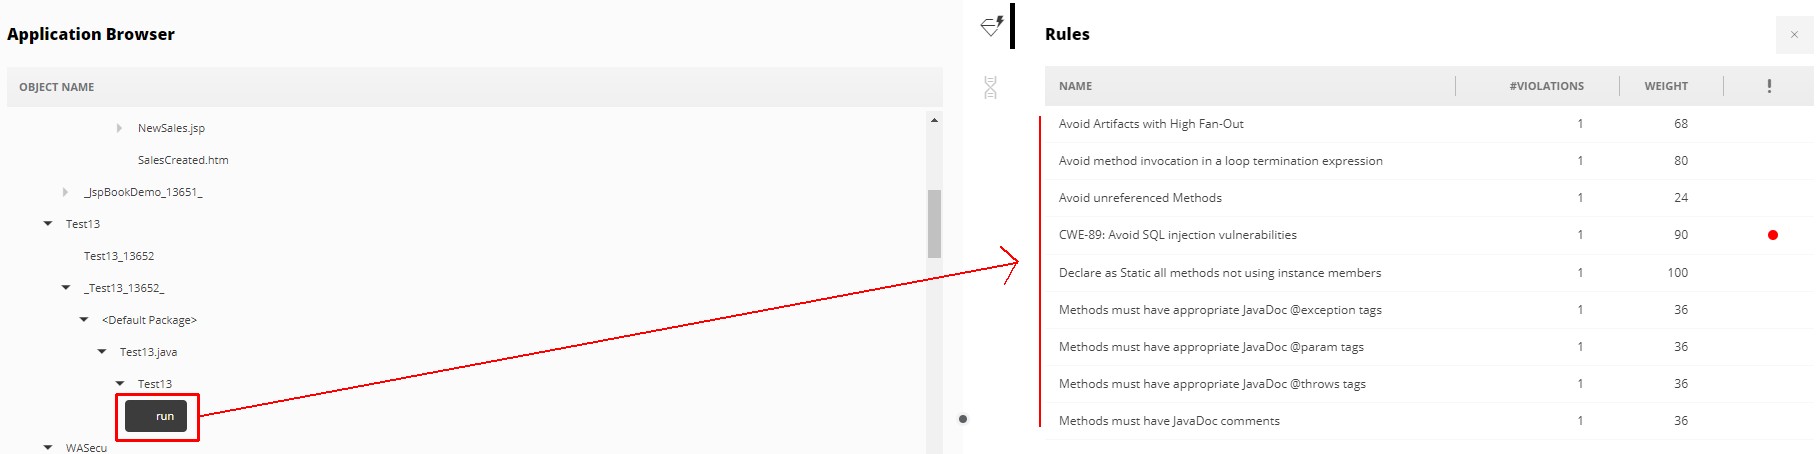
| Column | Meaning |
|---|---|
| Name | The rule being violated |
| #Violations or #Critical Violations | How many times, subject to the critical violations filter |
| Weight | The compounded weight of the rule, calculated as the weight of the parent technical criterion multiplied by the weight of the rule |
| Critical Rule | A red dot marks a rule set as critical in the assessment model |
Clicking the Weight header cycles through four sort orders: weight descending, weight ascending, critical rules descending, critical rules ascending.
Violations and rule documentation
Clicking a rule shifts the panel left and opens a new one listing the objects that violate it, in alphabetical order, together with the rule’s documentation:
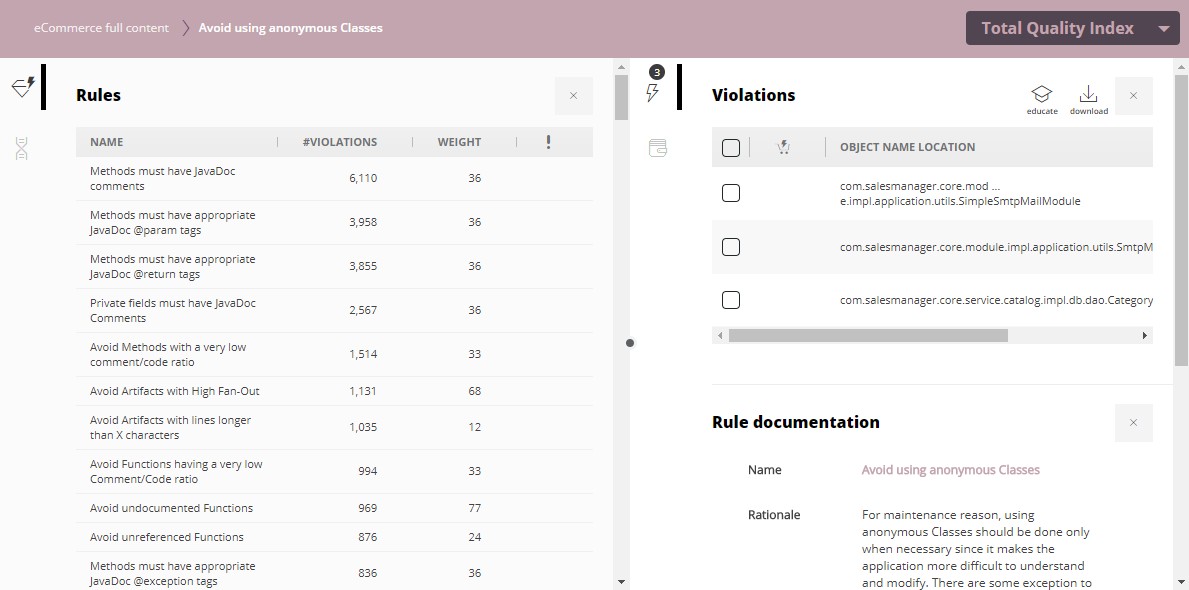
The Plan, Object Name Location, Risk and Status columns work exactly as they do in Risk investigation.
Only 10 violations load initially. SHOW MORE adds them in increments, and All stops at 5000 by default - a configurable ceiling, see violationsCount. Where there are many, the search button filters on object name and location.
Parameter details
For a parameterized rule, the parameter name, technology and value, for both the current and the previous snapshot:

Rules without parameters report “No parameter details available”.
Source code
Selecting an object opens its source code:
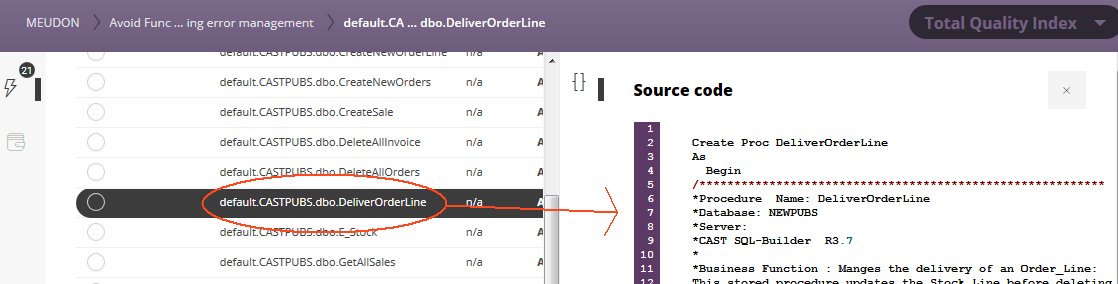
Source code display in this view is more limited than in Risk investigation:
- What you see is the whole file containing the object, so a very large file affects display performance.
- Violation bookmarks are not shown. The entire object is highlighted within its file instead.
- Violations are not shown for rules that reference user input security elements - OWASP security rules, “Avoid direct or indirect remote calls inside a loop”, and any copy and paste rule.
Impacted transactions
For a selected object, the transactions it participates in:
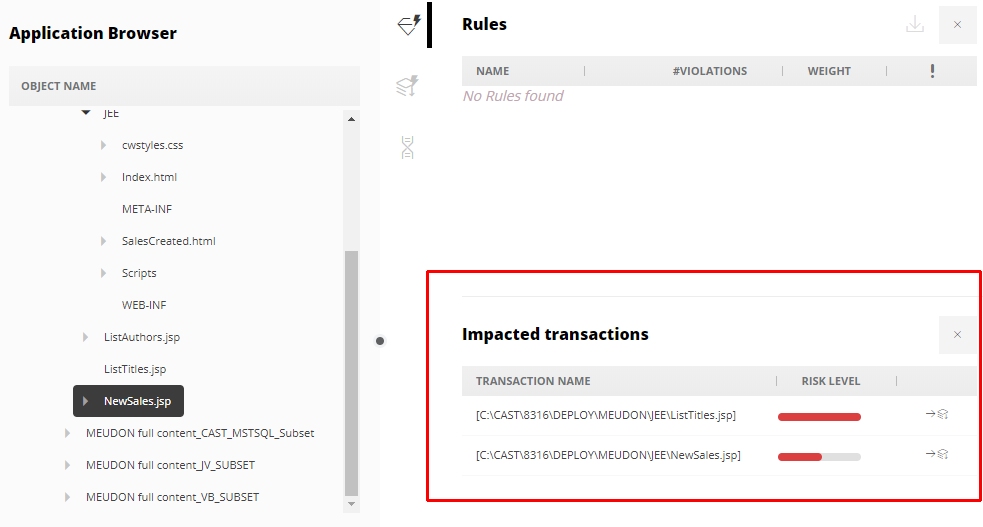
| Column | Meaning |
|---|---|
| Transaction Name | The transaction the object takes part in |
| Risk Level | The transaction’s TRI (Transaction Risk Index) value |
An icon on each row opens the transaction in Transaction investigation.
This section only works while the active Health Measure is Robustness, Security or Efficiency.
Technical properties
The properties of the selected object, in two views.
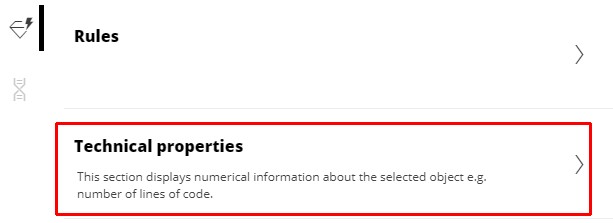
Global view gives a written description of the object’s technical properties:
Detail view lists the measured values:
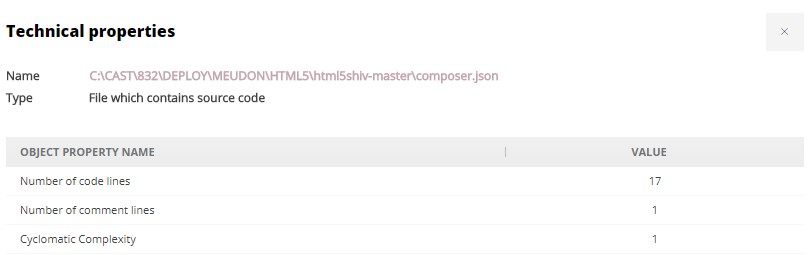
Number of code lines, number of comment lines, number of commented code lines, ratio of comment lines to code lines, coupling, cyclomatic complexity, essential complexity, integration complexity, distinct operands, distinct operators, fan in, fan out, Halstead program length, Halstead program vocabulary, and Halstead volume.
Objects with none of these report “No Technical Properties available for this object”.
Header icons
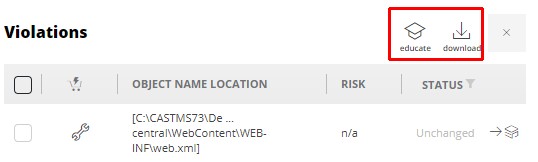
| Icon | Action |
|---|---|
| Educate | Adds the rule to the Education list |
| Download | Exports the violation list to Excel |