Exporting data
Overview
Most tables in the Engineering Dashboard can be exported to Excel using the download icon in the table header:
The icon is disabled when the table holds no data.
What can be exported
| View | Exportable |
|---|---|
| Risk investigation | Health Measures, Business Criteria, technical criteria, rules, distributions and measures, and violations |
| Application investigation, Transaction investigation | Violations |
| Action plan | Violations |
| Exclusions, both scheduled and active | Violations |
| Education | Rules |
| Continuous improvement | Rules |
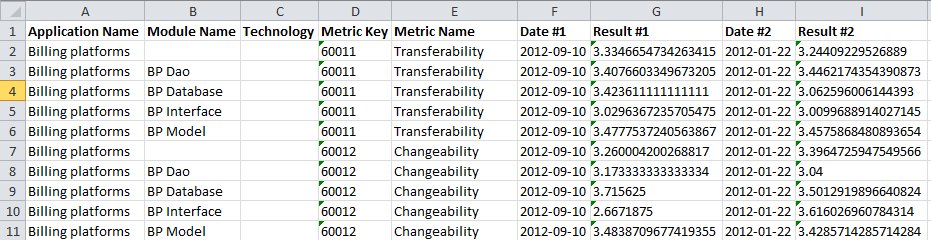
Depending on your browser you are prompted to open or save the file, which contains the data as columns:
What the export does and does not contain
The export is not a full copy of what is on screen:
- Rule criticality and weight are not included.
- The percentage variation between snapshots is not included, though the grades for the current and previous snapshot both are.
A blank cell usually means one of two things: a blank Module Name indicates data common to all modules, and a blank Technology indicates multiple technologies.
The four calculation levels
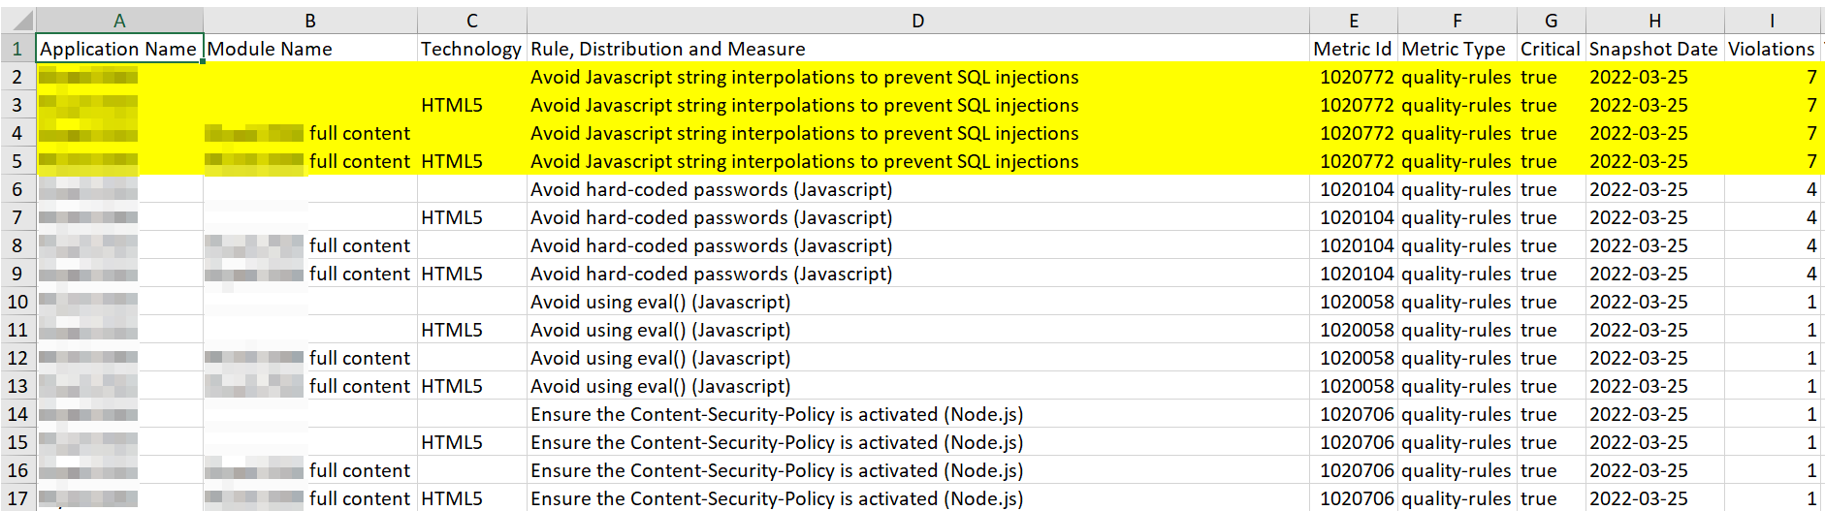
Results are calculated at four levels, and the spreadsheet reports each of them:
- Application
- Application and technology
- Module
- Module and technology
Where an application has a single technology and a single module - a full content module - all four levels can be identical, depending on how the analysis was defined:
Associated values on violation exports
Exporting at violation level may add a column carrying the rule’s associated value, which is a rule-specific output rather than a generic field.
For the rule “Action Artifacts should not directly call a JSP page”, for example, the associated value is the JSP page name - so the column names the JSP file that breaks the rule:
