Automated Enhancement Point
Overview
The Automated Enhancement Point section reports how much an application changed between releases, and at what quality and complexity. It is available at single-application level only, and only in the default view - the ISO-5055 View does not carry it. Reach it from the AEP tile:
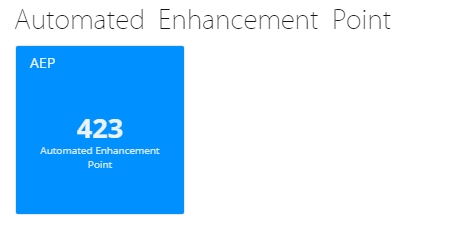
What the tile shows, and whether it can be drilled into, depends on the enhancement function point counting mode used when the current snapshot was generated: AEP or the legacy EFP. The counting mode is set per application in the analysis configuration - see Enhancement measure.
When the AEP measure is enabled
The tile shows the total number of Automated Enhancement Points found in the application:
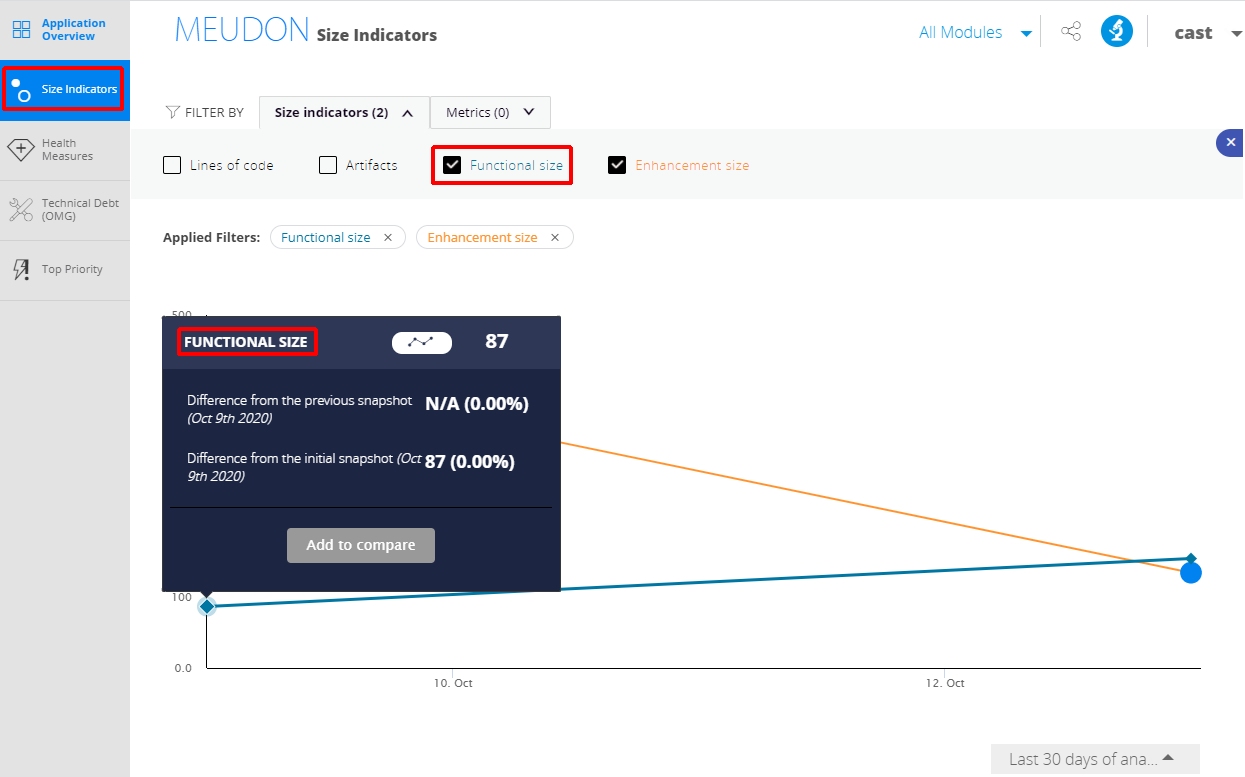
Clicking it opens the Size Indicators section with the Enhancement Size filter applied, graphing the AEP value across successive snapshots. Roll over a snapshot point for its detail:
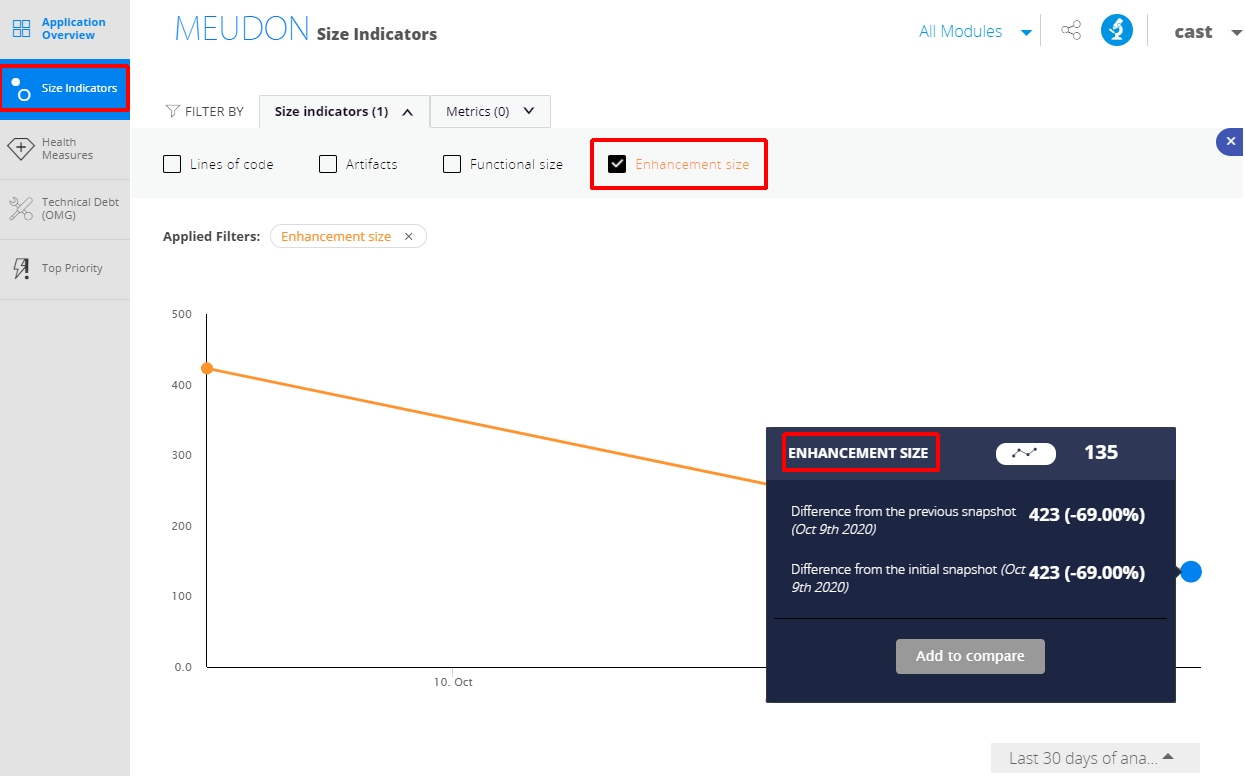
Add the Functional Size filter to see Automated Function Point data alongside it:
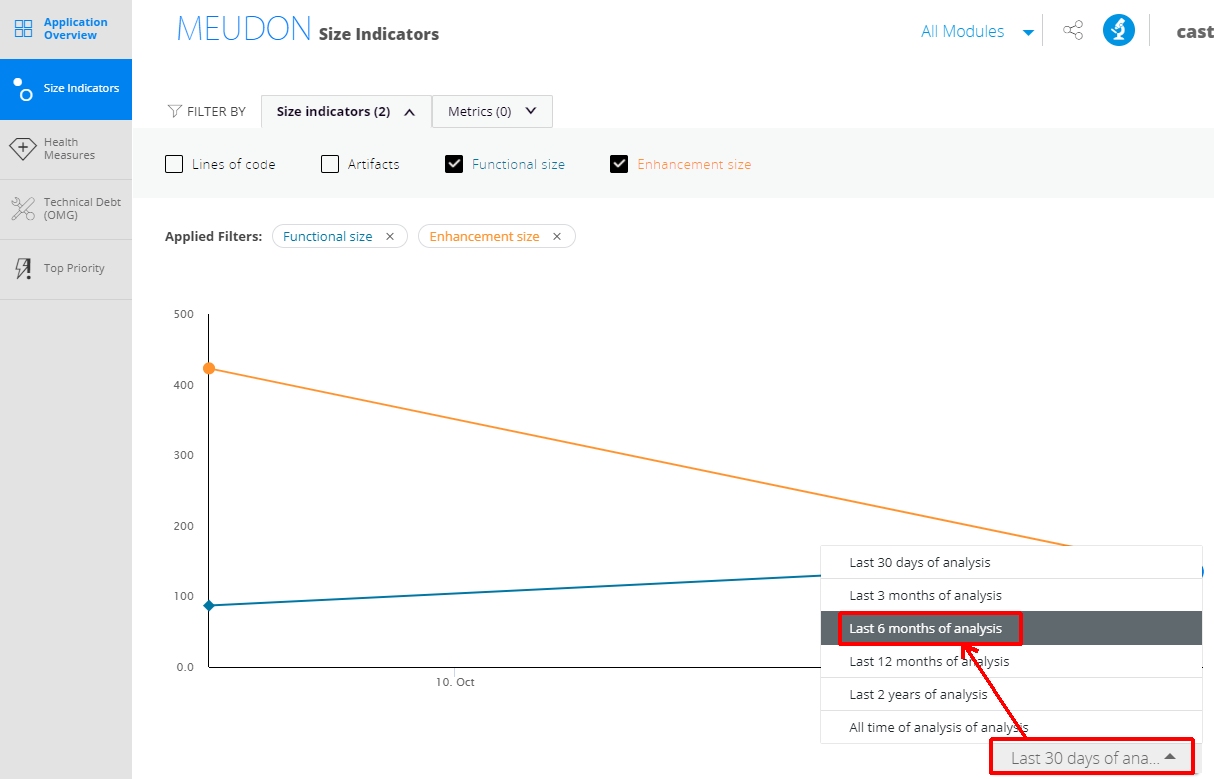
The graph covers the last 12 months by default, and a different period can be selected:
Size of the enhancement
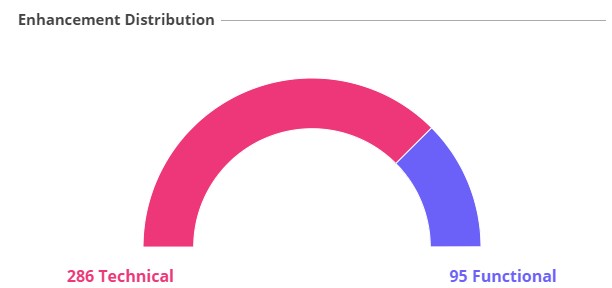
Enhancement Distribution shows how modifications are distributed between two points of measure, sized in Automated Enhancement Points and split into functional and technical shares:
Impact is the percentage of the application’s transactions affected by the changes - the number of changed transactions out of the total. Impacted transactions include both new and modified transactions:
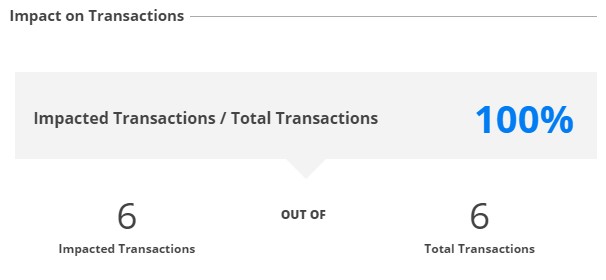
The total number of transactions and the total number of impacted transactions both include deleted transactions, because deleted transactions affect the AEP result.
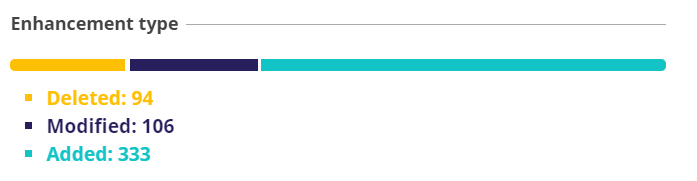
Enhancement Type breaks the changes into added, deleted and modified:
Quality of the enhancement
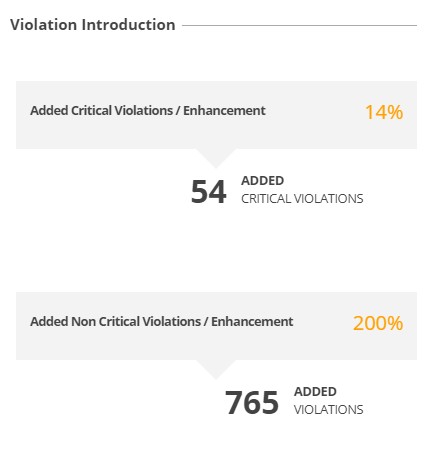
Violation introduction focuses on critical and non-critical violations added in the current snapshot:
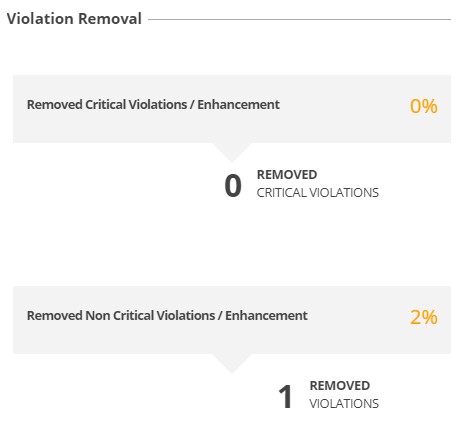
Violation removal focuses on those removed:
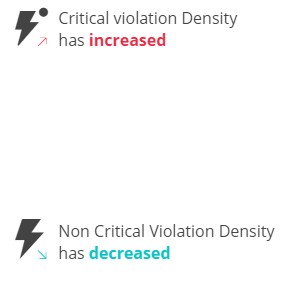
Violation density summarises whether critical and non-critical violation density has risen or fallen:
Complexity of the enhancement
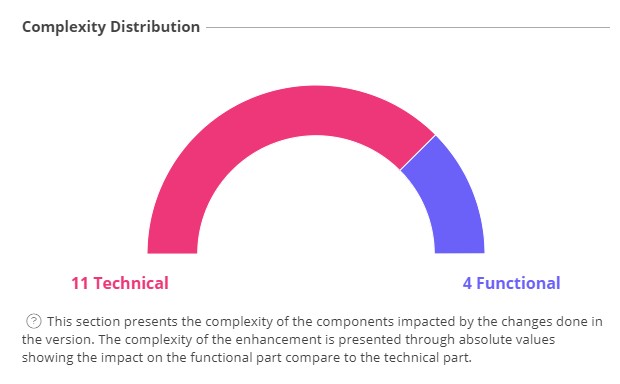
Complexity distribution shows the complexity of the components affected by the version’s changes, as absolute values comparing the functional and technical parts:
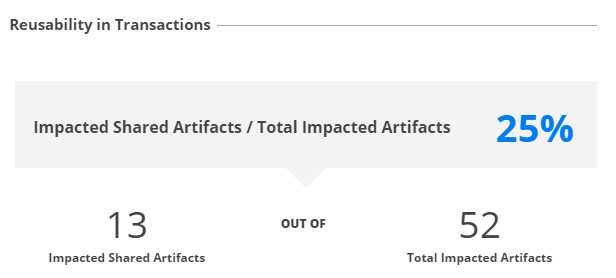
Reusability in transactions shows the impact of changing a small number of artifacts on the total number of transactions:
When the legacy EFP measure is enabled
The AEP tile is dedicated to AEP data, so under the EFP measure it shows nothing:
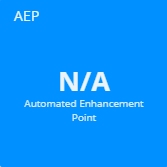
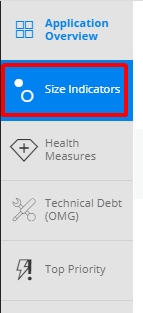
A tile showing N/A cannot be drilled into. To reach the EFP and AFP data instead, click the Technical Size tile on the application home page - or any other tile if Technical Size is not available - and work in the Size Indicators tab:
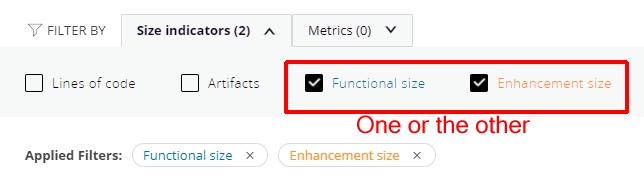
Select either the Functional Size or Enhancement Size filter:
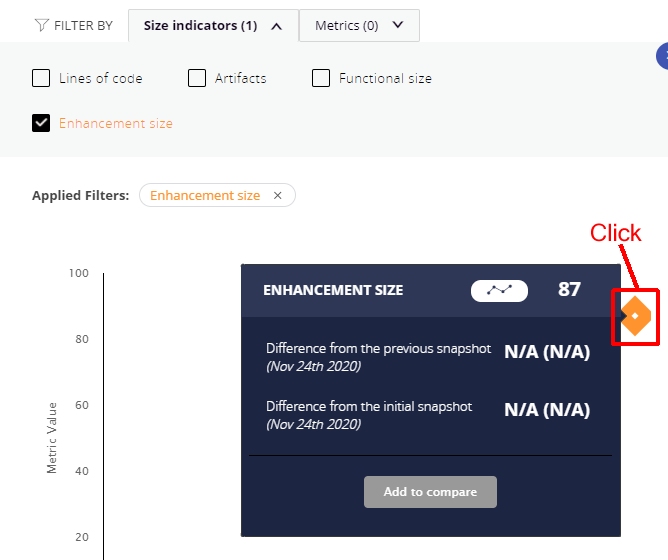
Then click the indicator for the snapshot you want:
Exporting function point data
Export icons are provided for Enhanced and Automated Function Point data:
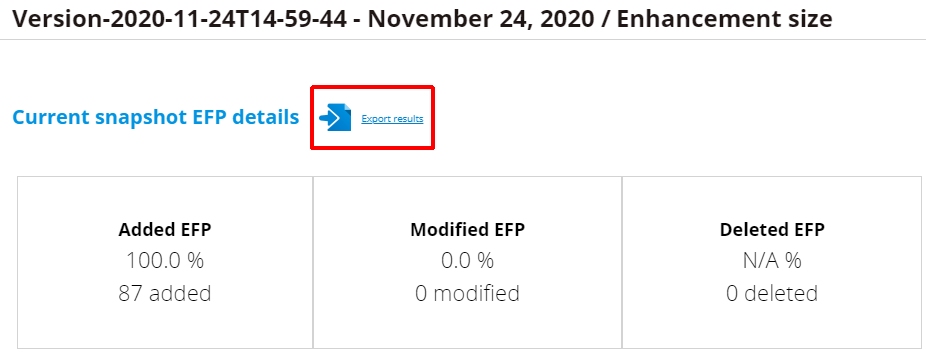
Whether these icons are active depends on how the dashboards were deployed and configured. If they are inactive in your installation, see Dashboards administration.
Clicking an icon prompts you to open or save the file. The export details how the Enhanced or Automated Function Point value was derived:
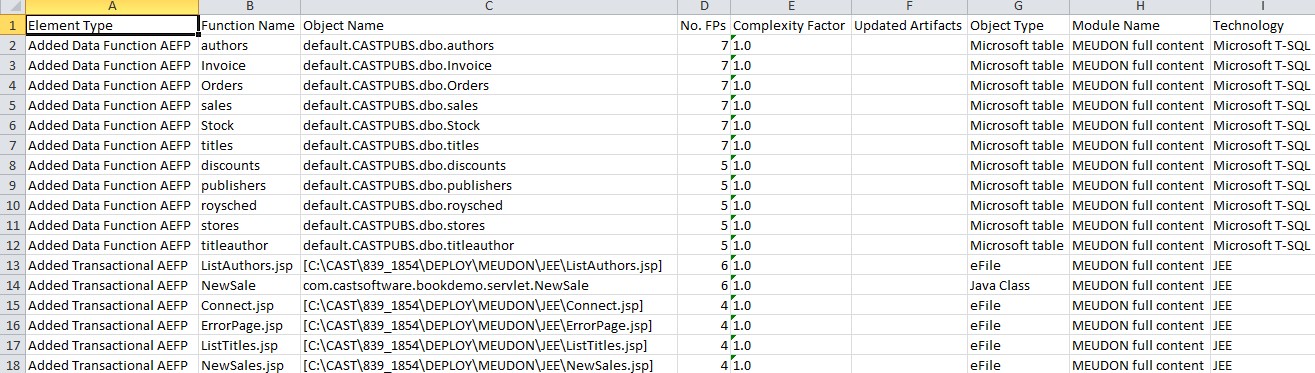
When exporting Enhancement Size, both AEFP (Automated Enhancement Function Points) and AETP (Automated Enhancement Technical Points) are provided, on separate tabs:
- Functional Part tab holds the AEFP data
- Technical Part tab holds the AETP data

Functional Size columns
Exported for Automated Function Point data.
| Column | Description | Type | Occurs |
|---|---|---|---|
| Element Type | Whether the object is a Data Function or a Transaction | String | 1 |
| Function Name | Name of the function | String | 1 |
| Object Name | Full name of the object | String | 1 |
| Nb of FPs | Number of function points for this function | Integer | 1 |
| Type | Function type | String | 0..1 |
| DET | Data Element Type | Integer | 0..1 |
| RET | Record Element Type | Integer | 0..1 |
| EIF | External Interface File | Integer | 0..1 |
| ILF | Internal Logical File | Integer | 0..1 |
| FTR | File Type Referenced | Integer | 0..1 |
| Object Type | Type of this function | String | 1 |
| Module name | Functional module containing this function | String | 1 |
| Technology | Technology this function belongs to | String | 1 |
Enhancement Size columns, Functional Part
| Column | Description | Type | Occurs |
|---|---|---|---|
| Element Type | Whether the object is a Data Function or a Transaction | String | 1 |
| Function Name | Name of the function | String | 1 |
| Object Name | Full name of the object | String | 1 |
| Nb of FPs | Number of function points for this function | Integer | 1 |
| Complexity Factor | OMG-compliant formula used to calculate complexity | Integer | 1 |
| Updated Artifacts | Number of artifacts that have been updated | Integer | 1 |
| Object Type | Type of this function | String | 1 |
| Module name | Functional module containing this function | String | 1 |
| Technology | Technology this function belongs to | String | 1 |
Enhancement Size columns, Technical Part
| Column | Description | Type | Occurs |
|---|---|---|---|
| Object id | Object identifier | Integer | 1 |
| Object name | Full name of the object | String | 1 |
| Object name location | The object’s parent | String | 1 |
| Object type | Type of object | String | 1 |
| Object status | Status of the object: added, deleted or updated | Integer | 1 |
| Effort complexity | Effort complexity value | Integer | 1 |
| Equivalence ratio | Equivalence ratio value | Integer | 1 |
| AEP | Automated Enhancement Points value | Integer | 1 |
Exporting to CSV instead
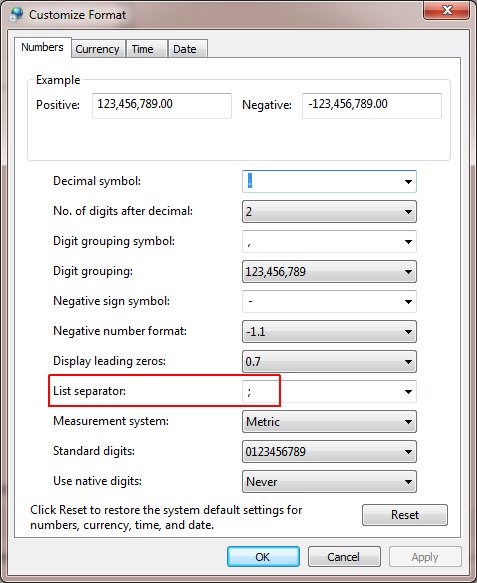
The export format is Microsoft Excel (.xlsx) by default and can be changed to .csv by configuration - see Configuration options.
CSV exports use the semicolon (;) as the delimiter. On Windows you may need to change the List Separator value under Control Panel > Region and Settings > Formats > Additional Settings for the file to open correctly: