Overview section
Overview
The Overview section is the top half of both landing pages. Each tile carries the value from the most recent snapshot for one measure: a Health Measure grade, a size, a violation count, and so on.
At multi-application level a tile shows either a sum across all applications (Technical Size, for example) or an average of them (TQI), depending on what the measure is.
This page describes the default layout. The Overview and Trends sections are both defined in a configuration file - one for the portfolio view and one for a single application - so an administrator can add tiles, remove them, change what a tile measures, or reorder them - see Management Dashboard tiles. What you see may therefore not match the set described here.
Which tiles appear where
Not every tile is available at both levels.
| Tile | Multi-application | Single application |
|---|---|---|
| Number of applications | Yes | No |
| Health Measures - TQI, Robustness, Efficiency, Security, Changeability, Transferability | Yes | Yes |
| Technical Size and Functional and Enhancement | Yes | Yes |
| Critical Violations | Yes | Yes |
| Technical Debt and Technical Debt (OMG) | Yes | Yes |
| Top Priority | Yes | Yes |
| Application Mapping | Yes | No |
| Top 5 Riskiest Applications | Yes | No |
| Top Critical Rules | Yes | Drill-down not available |
| Modules Mapping | No | Yes |
| Technologies Overview | No | Yes |
| Top Riskiest Modules | No | Yes |
Number of applications
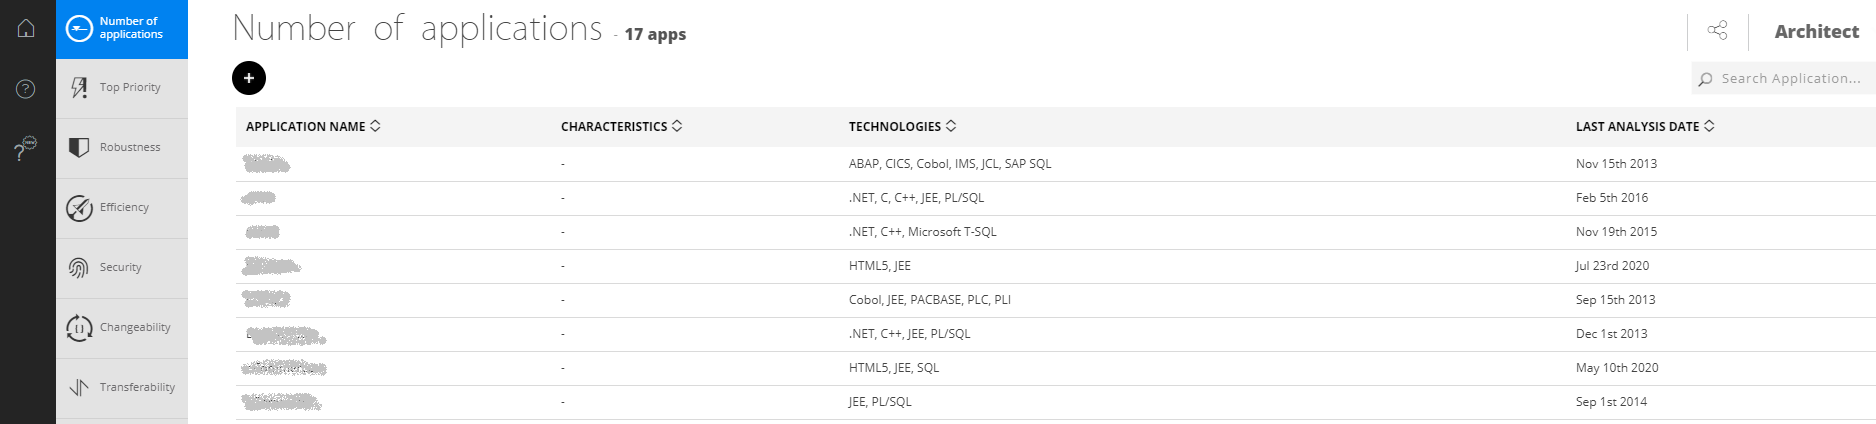
Counts the applications available in the dashboard. Clicking it lists them all, and clicking any entry opens that application’s landing page. Use Search Application to match on the opening letters of a name rather than scrolling:
Health Measure tiles

One tile each for TQI (Total Quality Index), Robustness, Efficiency, Security, Changeability and Transferability.
Each shows a grade between 1.0 (poor) and 4.0 (good). A Health Measure is built from multiple technical criteria, which are in turn built from rules; the grade of each contributes to the total. At multi-application level the grade is the average across all applications in the dashboard.
Drilling down
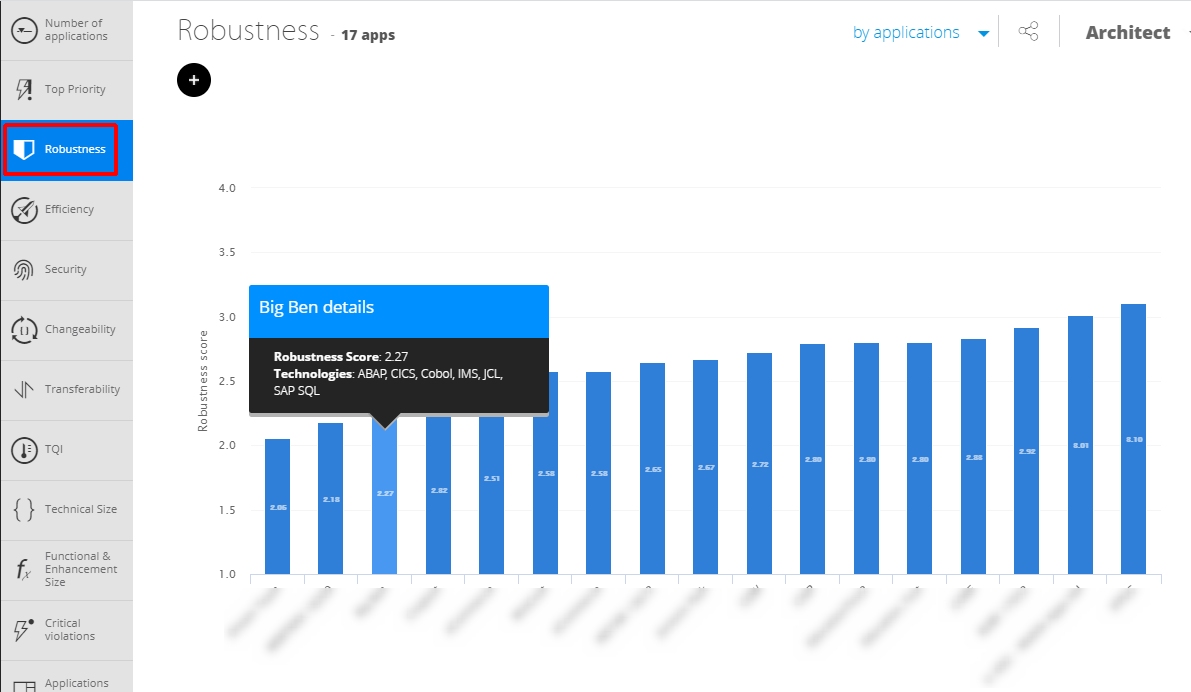
At multi-application level, clicking a tile shows the grade per application as a bar graph. Rolling over a bar shows the technology detail behind it, and clicking a bar opens that application’s drill-down for the same Health Measure:
At single-application level, clicking a tile opens the detail for that Health Measure:
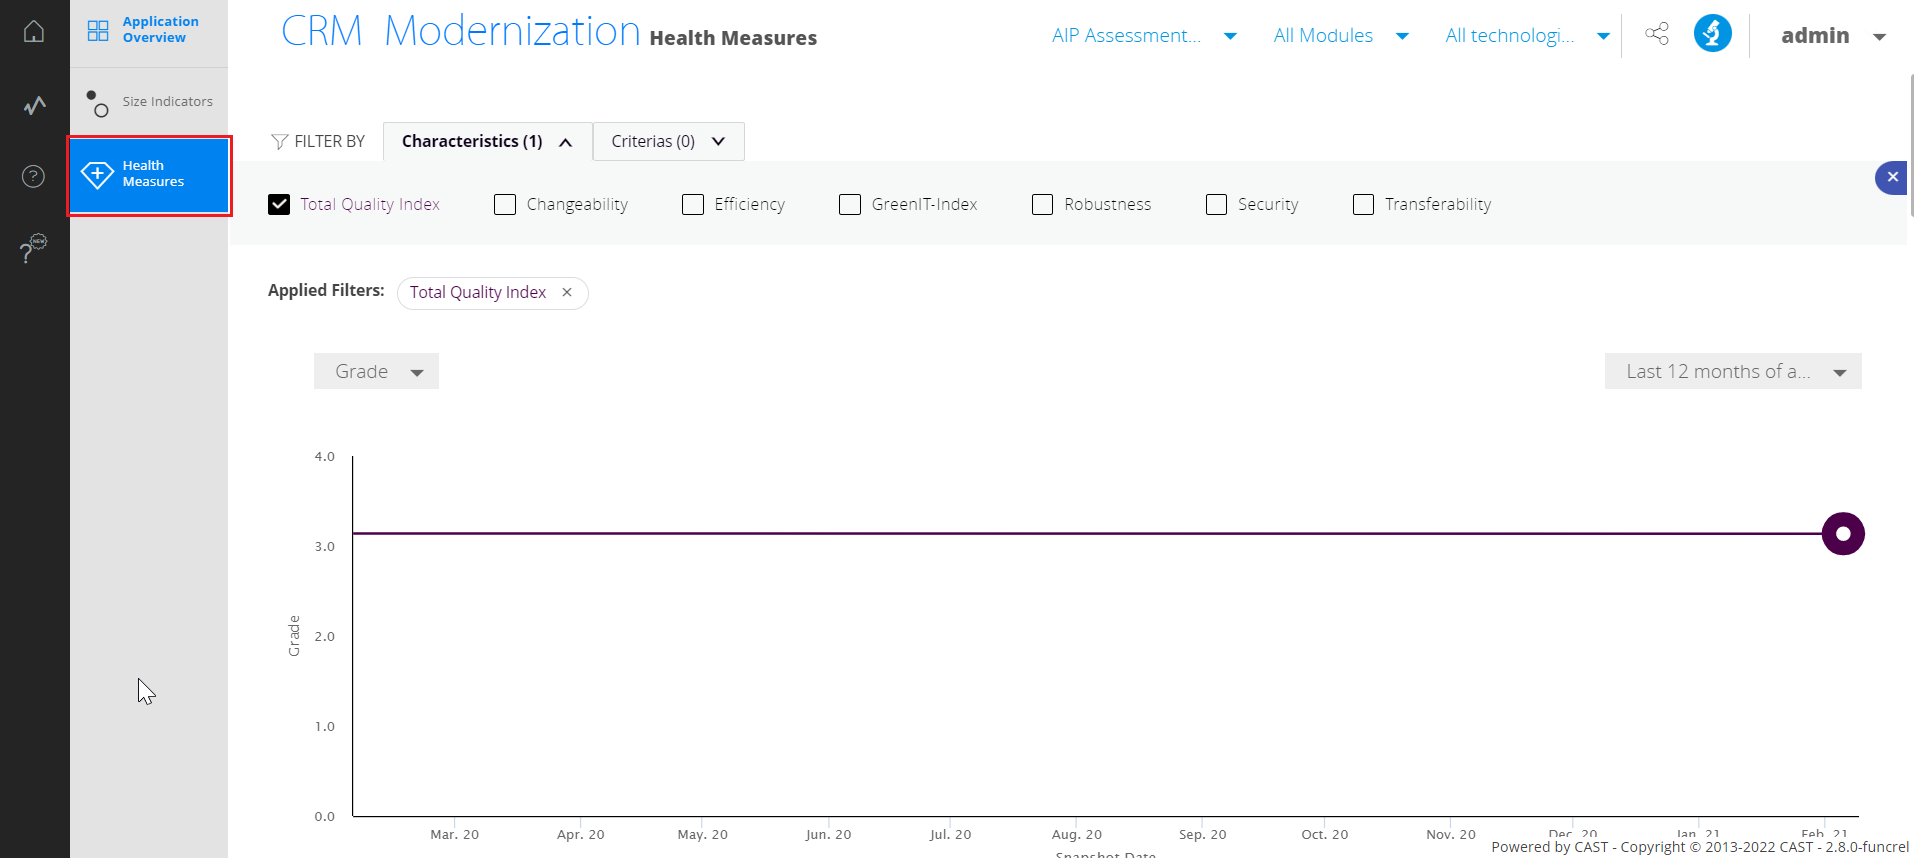
The single-application drill-down is made up of the five sections described below.
Grade evolution
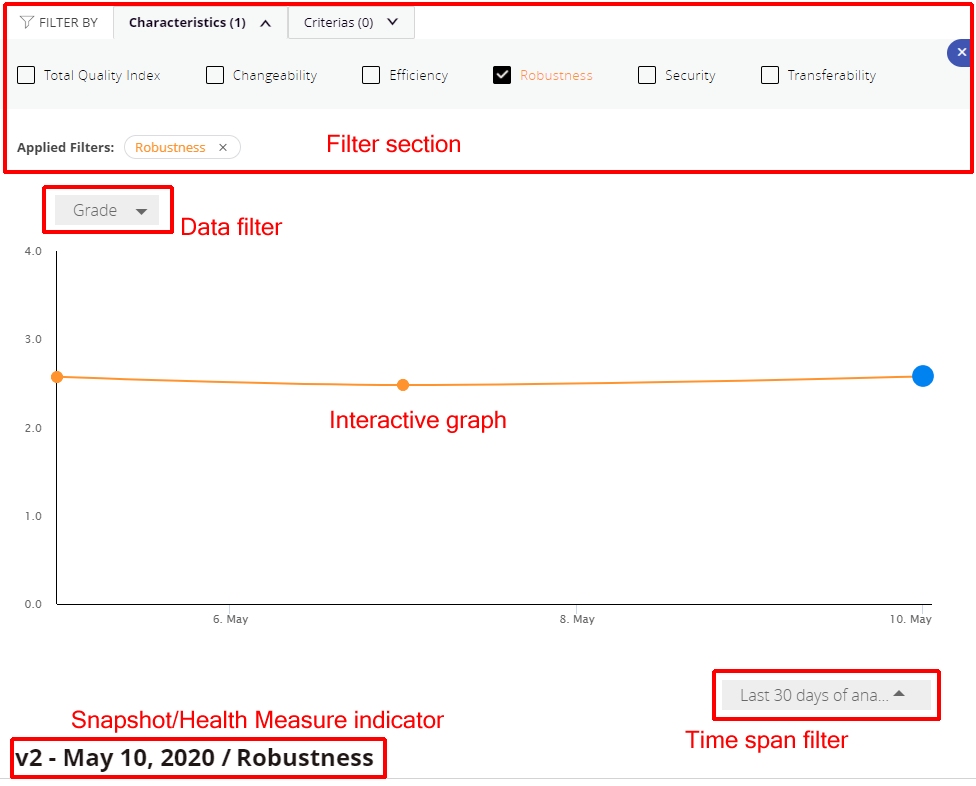
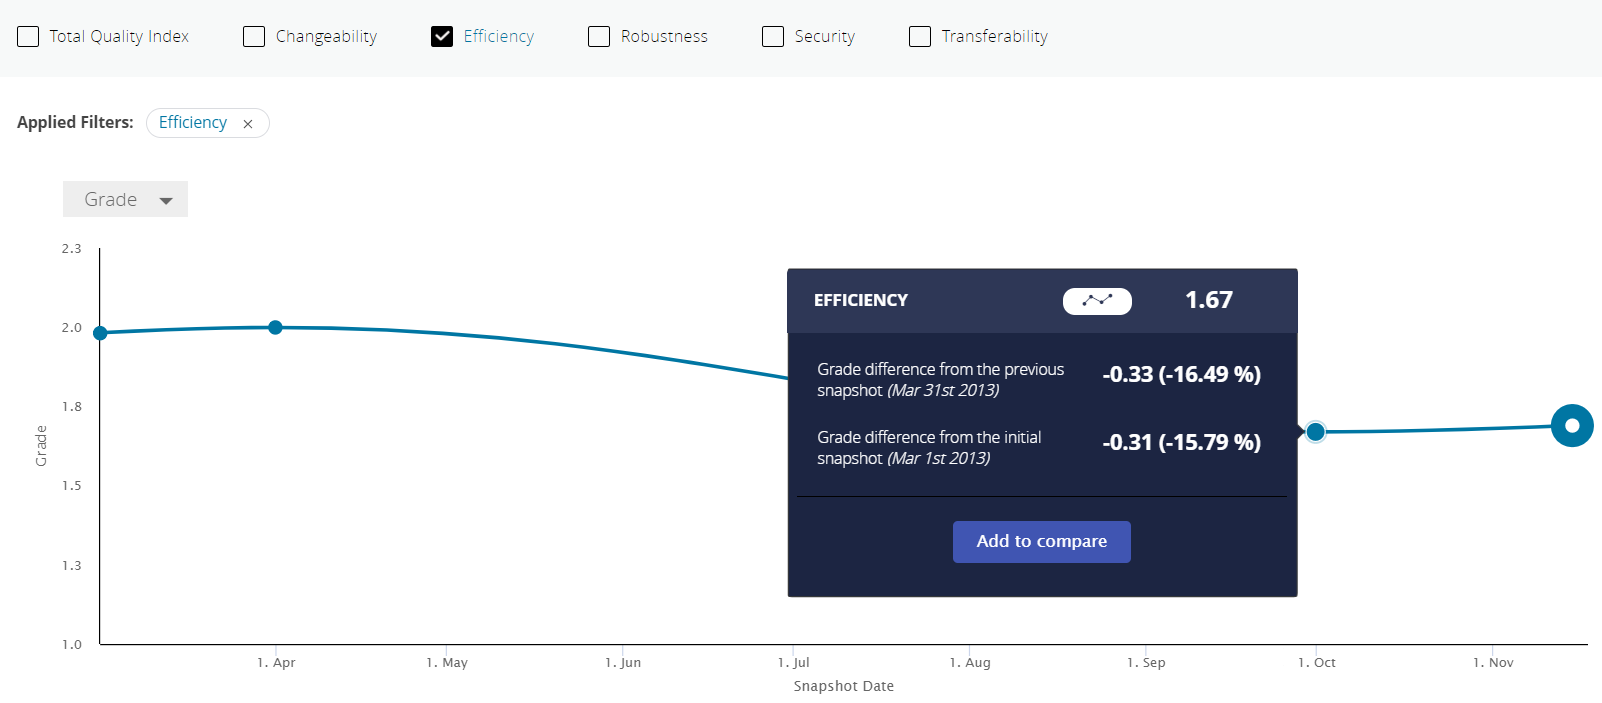
Plots the selected measure over successive snapshots. Four controls shape what you see:
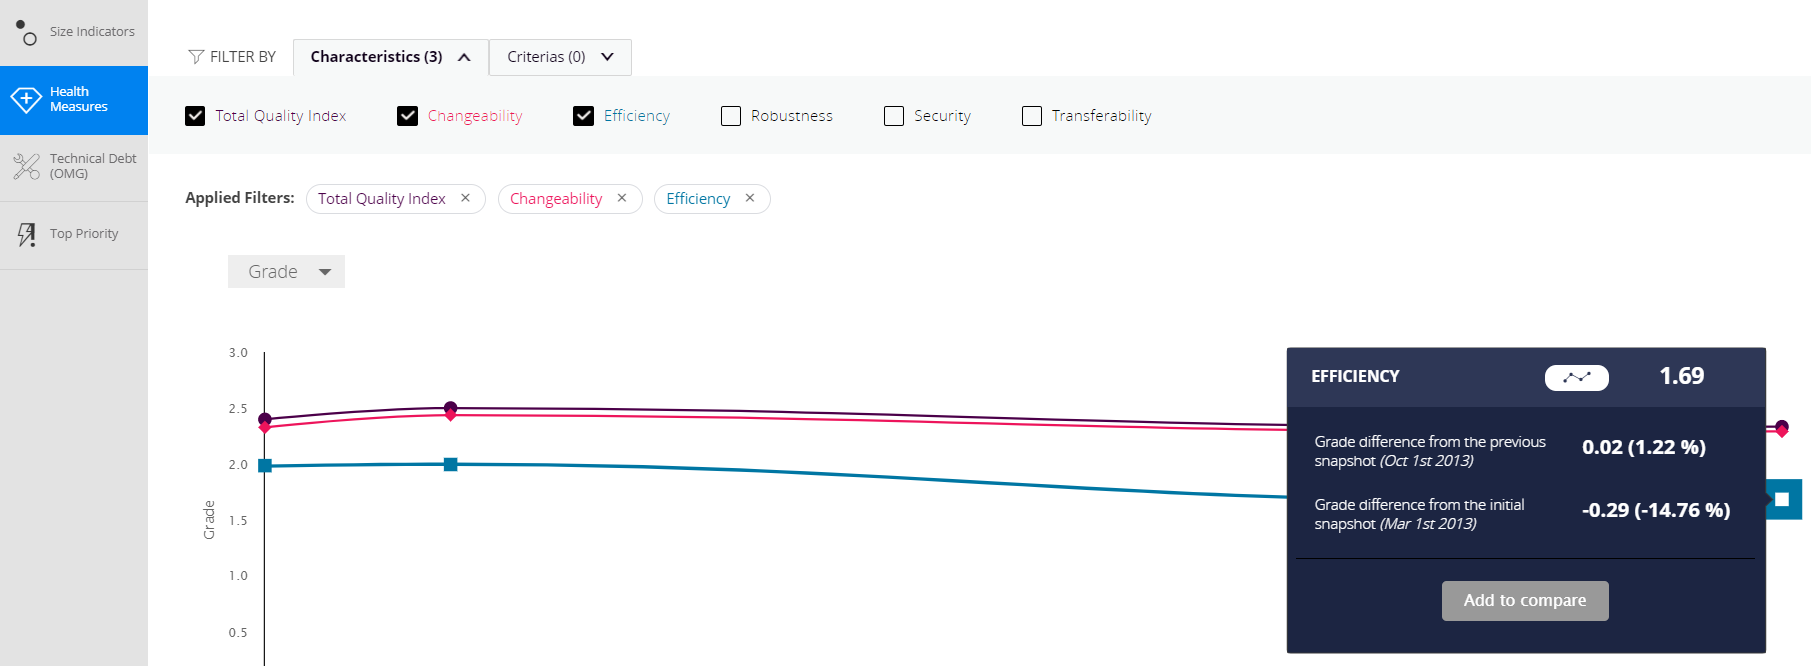
- Filter section - the Characteristics tab starts with the Health Measure whose tile you clicked; selecting more adds them to the graph. The Criteria tab narrows to specific technical criteria, none of which are selected by default.
- Data filter - the Grade drop-down switches what is plotted.
- Graph - clicking a point selects that snapshot. The snapshot is reselected automatically when you change the business criteria or sizing indicator.
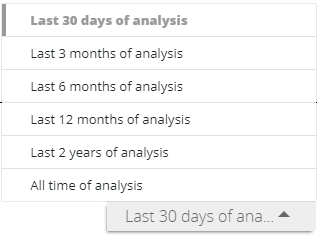
- Time span filter - restricts the graph to a period.
The Grade drop-down offers the following, for the default assessment model:
Compliance, Total Violations, Critical Violations, New Violations, Added Critical Violations, Removed Violations, Removed Critical Violations.
For industry standard models, only Compliance, Total Violations, New Violations and Removed Violations are offered.
Quick facts
Summarises the snapshot selected in the graph, for the characteristics and criteria you have filtered to:
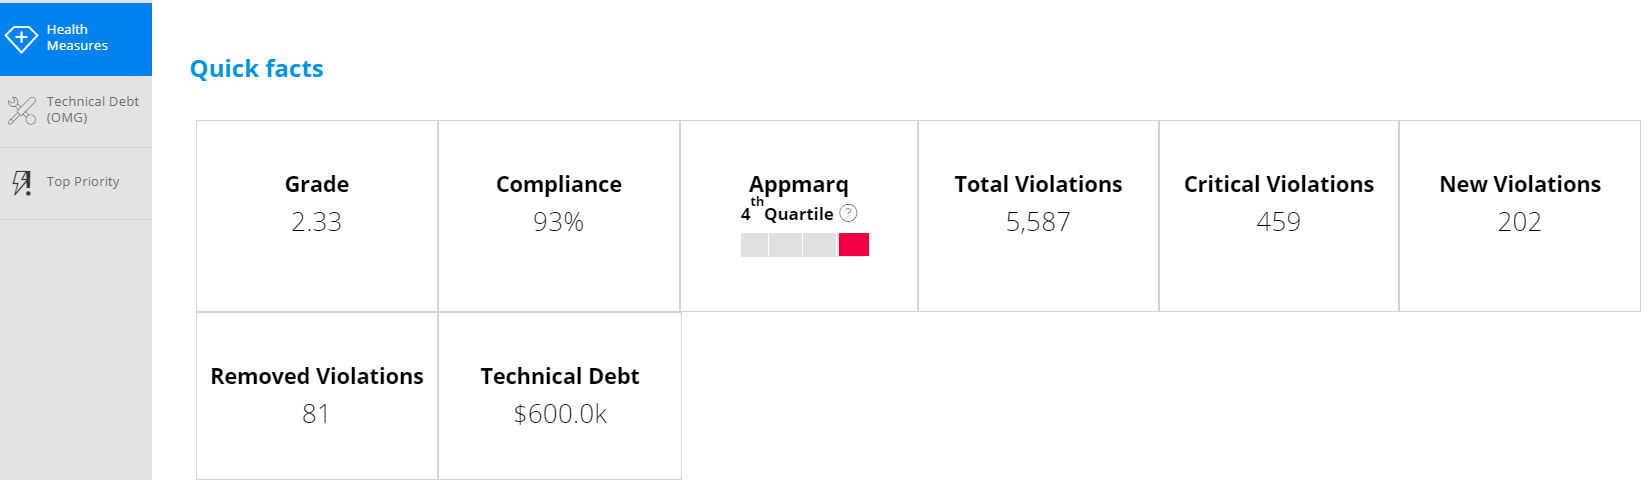
This is where the Appmarq quartile indicator appears.
The Grade value is not available in the ISO-5055 view.
Risk Profile
Lists the technical criteria of the selected snapshot, with their rules grouped underneath. Tick a criterion and select a snapshot in the graph to see its rule detail:
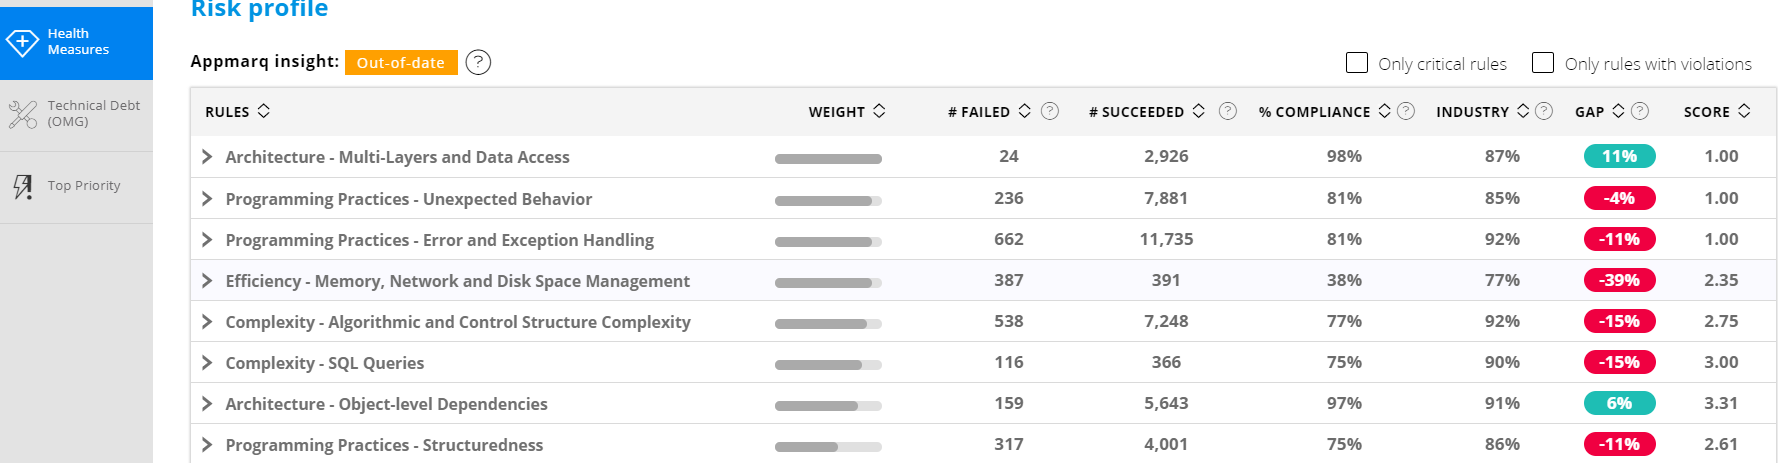
| Column | What it means |
|---|---|
| Weight | How important the item is. Higher weight means violations should be fixed sooner. For a rule this is the weight of the rule in its technical criterion multiplied by the weight of that criterion in the parent Health Measure. For a technical criterion it is its weight in the parent Health Measure. Roll over the value to see it |
| Failed | For a rule, the number of components whose source code violates it. For a technical criterion, the sum of failed checks across all its rules |
| Succeeded | For a rule, the number of components that were checked and did not violate it. For a technical criterion, the sum of succeeded checks across all its rules |
| Compliance | The compliance ratio. For a rule, the percentage of checked components that pass: a rule triggered 15 times with 1 violation gives 93%. For a technical criterion, the average across all its rules. Shows N/A while the Only critical rules and Only rules with violations filters are active |
| Industry | The average Appmarq compliance ratio for the same criterion or rule. See Appmarq insight |
| Gap | The difference between Compliance and Industry. Green means ahead of the industry average, red means behind. See Appmarq insight |
| Score/Grade | A value between 1.00 and 4.00 assessing the risk for the rule or criterion. Higher is better. Not available in the ISO-5055 view |
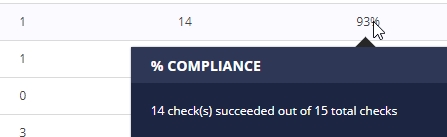
An Out-of-Date button appears here when the Appmarq data has not been refreshed - see Appmarq insight.
Module treemap
Shows every module in the selected application:
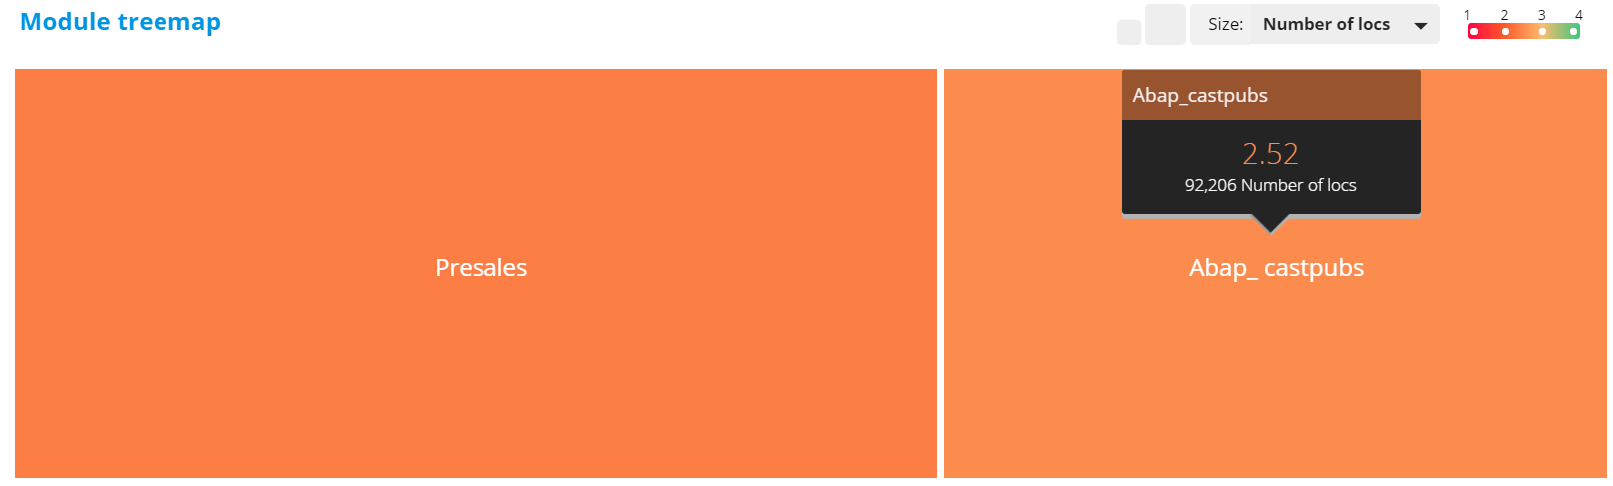
The module treemap is not available in the ISO-5055 view.
Snapshot comparison
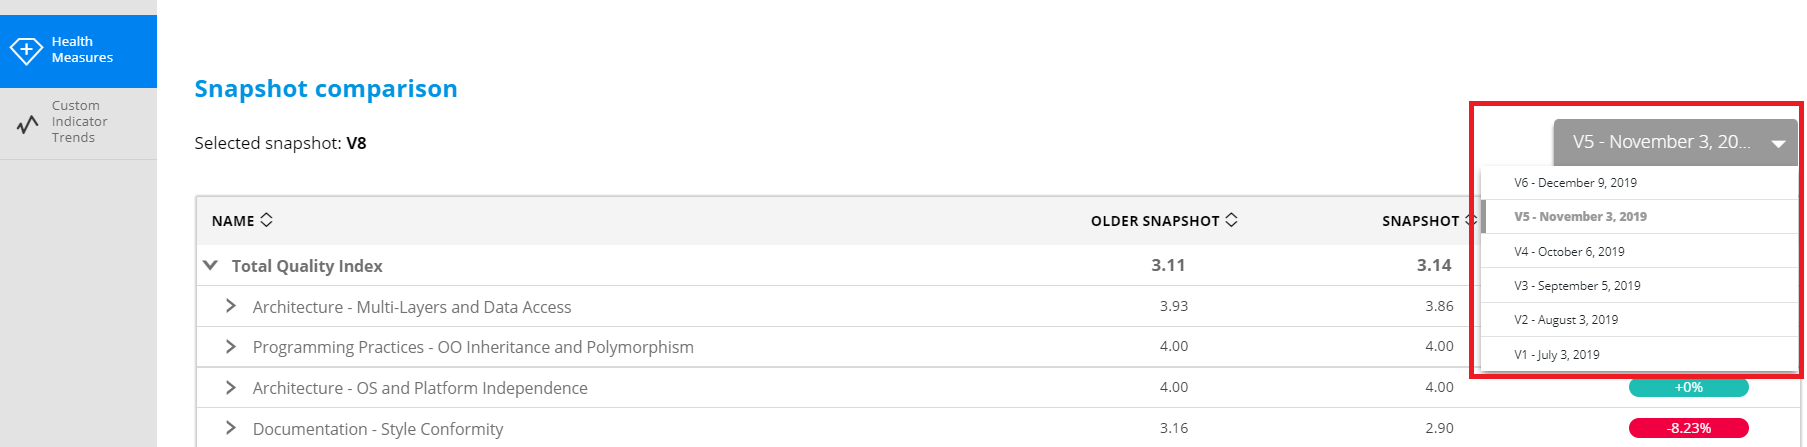
Compares two snapshots side by side. The currently selected snapshot is the reference, which out of the box is the most recent; selecting a different snapshot makes that one the reference instead. Choose an older snapshot from the drop-down to compare against:
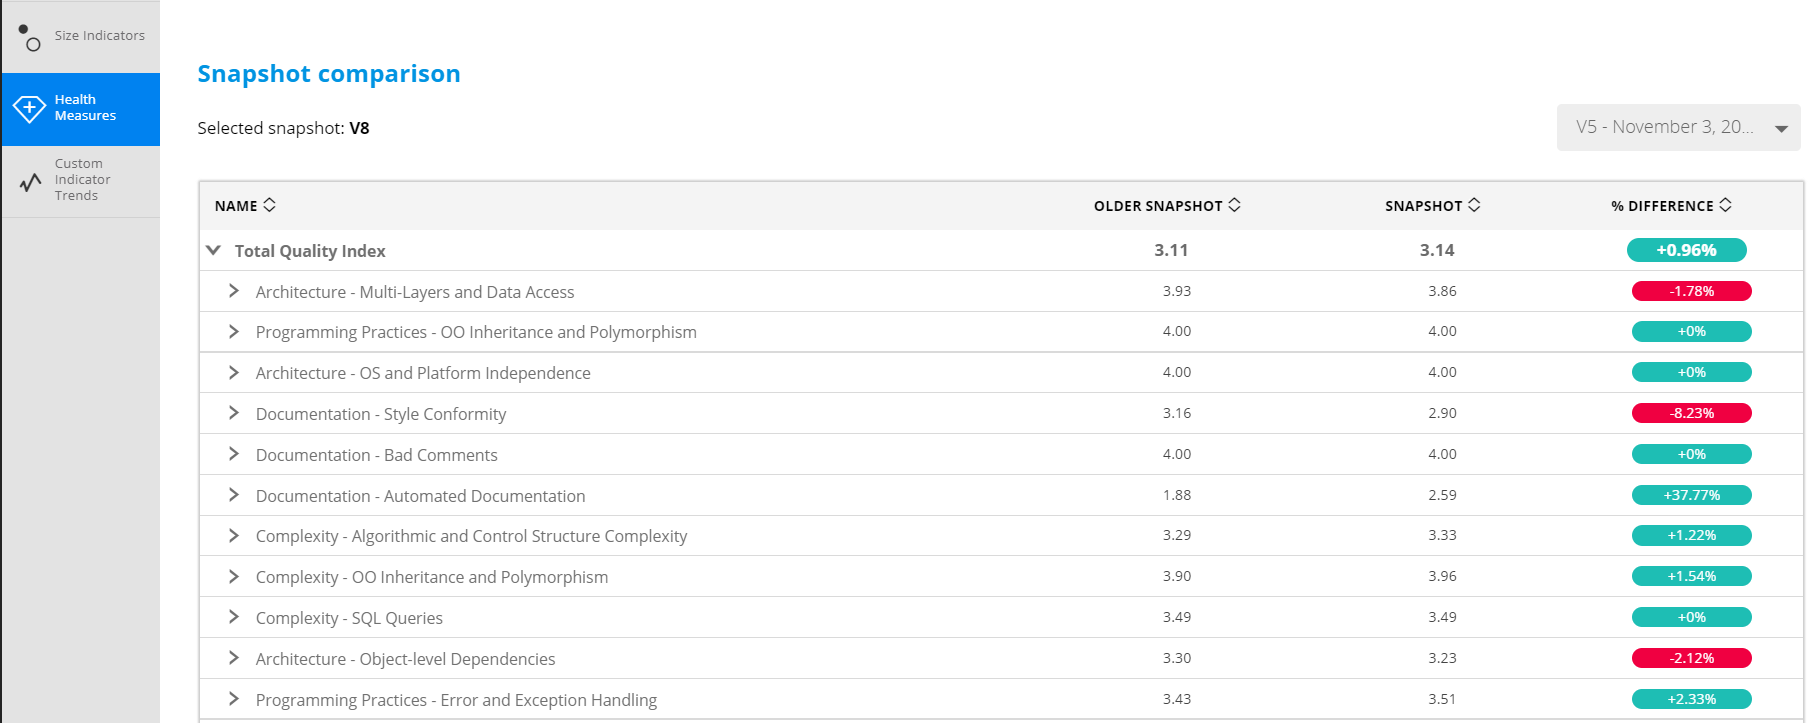
For a Health Measure, the comparison lists the technical criteria and rules contributing to it, with the rule name, the older snapshot value, the newer snapshot value and the percentage difference:
((grade of newer snapshot - grade of older snapshot) / older snapshot) * 100
The difference shows as N/A where the older snapshot’s value is zero, or where both values are zero.
Two or more snapshots are required. In the ISO-5055 view the comparison is based on Compliance.
Size Indicator tiles
Technical Size
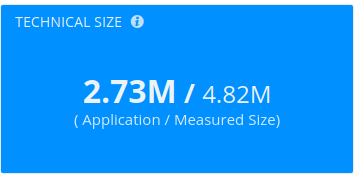
Reports lines of code as two values, Application Size and Measured Size:
| Tile label | Metric | What it counts |
|---|---|---|
| Application Size | 10151 |
A refined value produced during analysis. Counts only lines containing actual code, excluding comments and empty lines |
| Measured Size | 66071 |
A quick estimate produced during onboarding in fastscan mode. Counts all lines including comments and empty lines, across all files, including files that may later be excluded or unsupported |
Where only one of the two has been produced, the tile shows that value on its own.
Neither value will match line counts from third-party tools such as CLOC. The dashboard aggregates the LOC of the objects that make up each file, so file imports are not counted. The Measured Size value can be removed from the tile by configuration - see SizingMeasureResults.
Functional and Enhancement
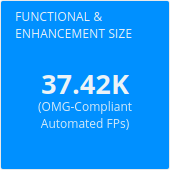
The number of OMG-compliant function points in the application. For the enhancement side of this data, see Automated Enhancement Point.
Drilling down
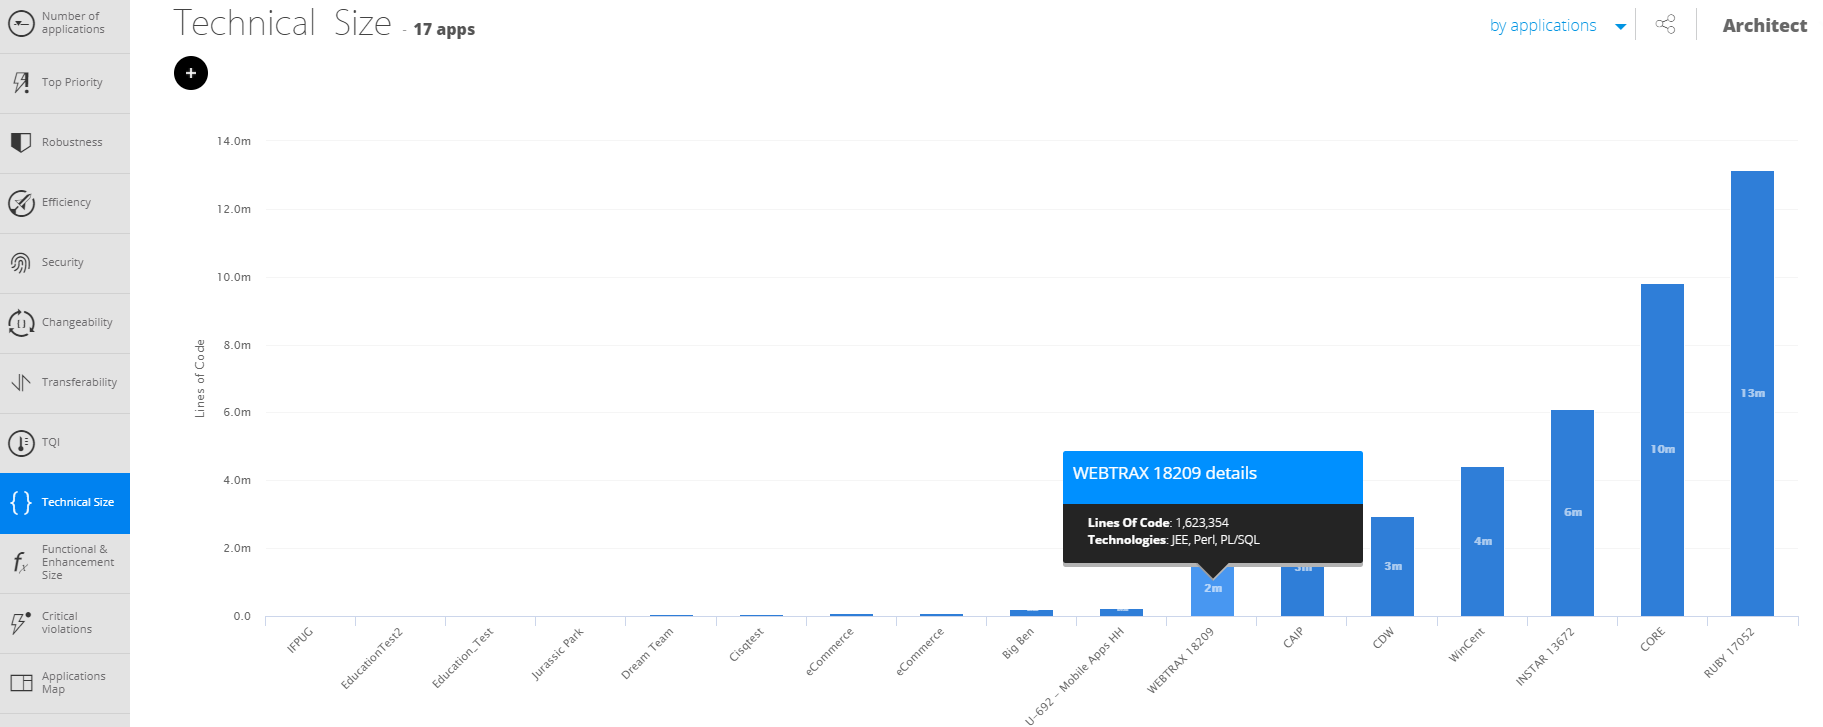
At multi-application level, clicking TECHNICAL SIZE graphs lines of code across all applications:
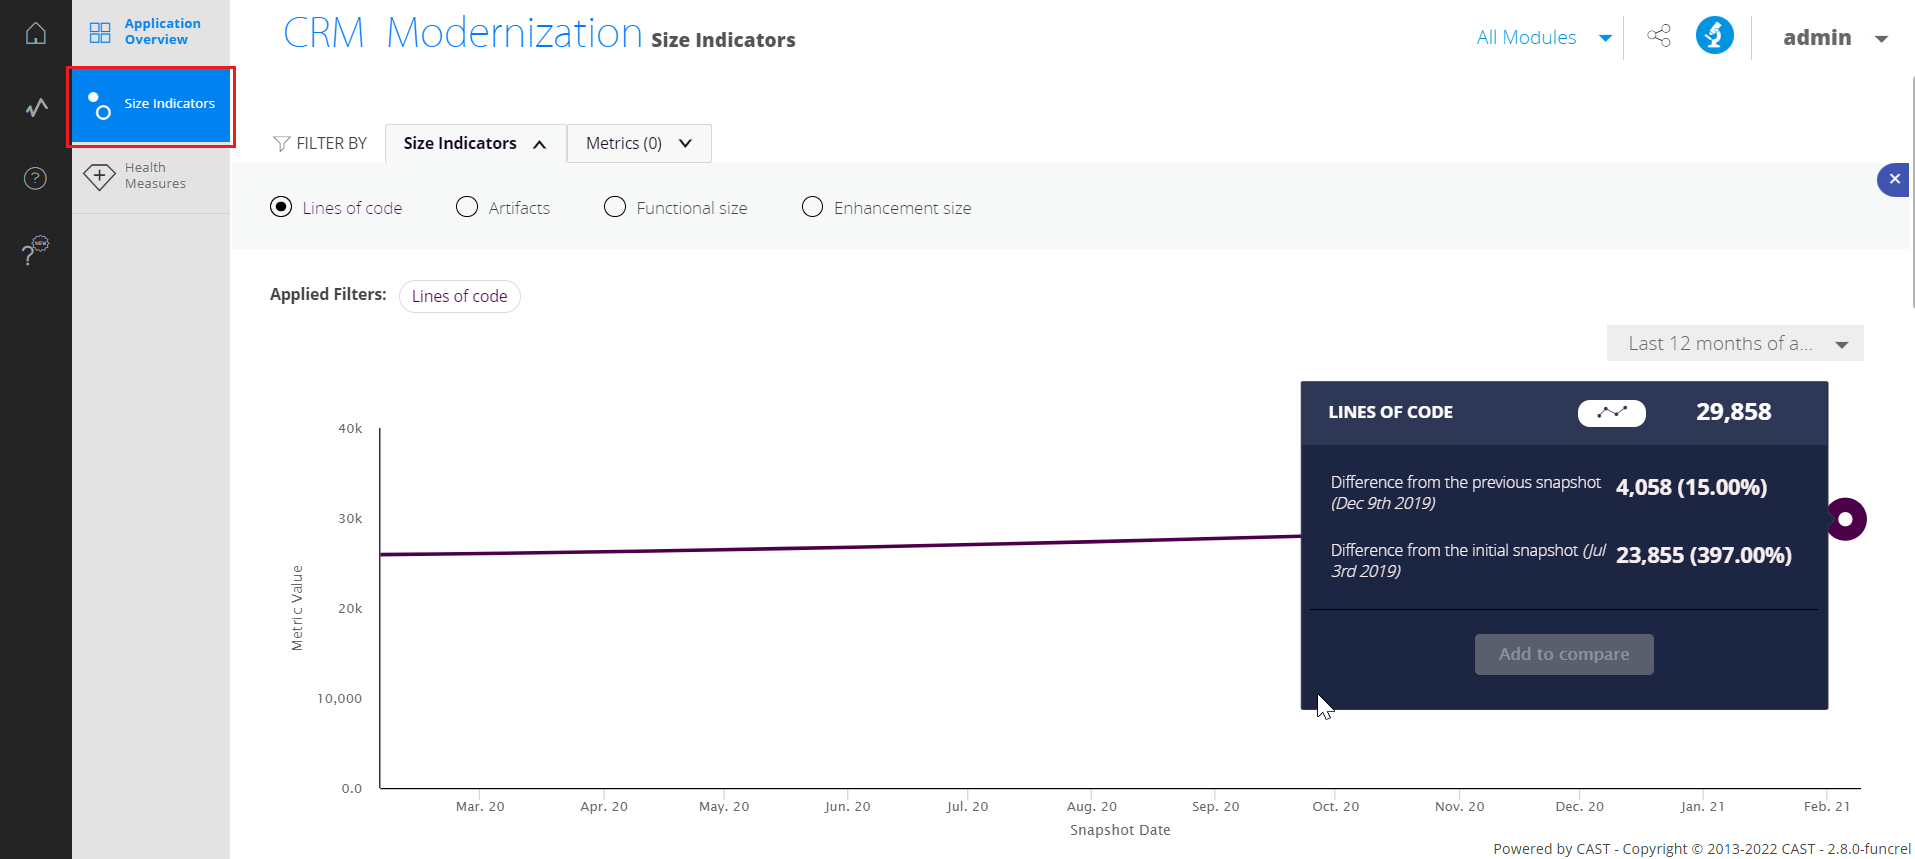
At single-application level it graphs the selected application over successive snapshots. Roll over a snapshot point to see the difference between two snapshots:
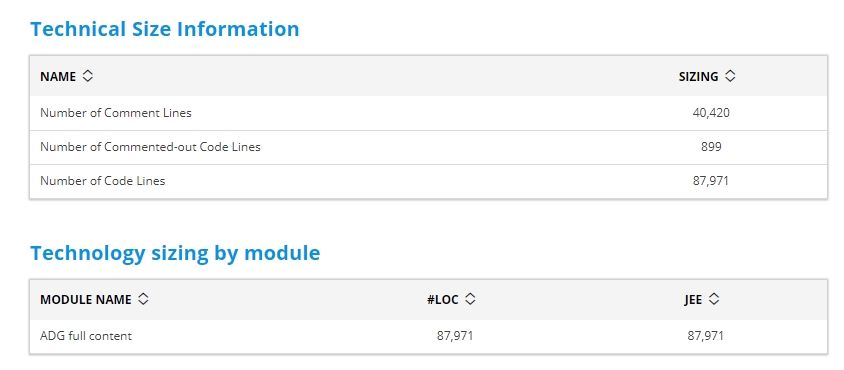
The Technical Size and Technology Sizing sections break the figures down for the whole application and for each module:
Snapshot comparison works as described above, except that it lists the sizing metrics contributing to the current sizing measure, with the measure name, both snapshot values and the percentage difference:
((sizing measure of newer snapshot - sizing measure of older snapshot) / older snapshot) * 100
For Functional and Enhancement comparisons:
- Where the contributing metrics differ between the two snapshots, the table shows “Different sizing metrics available for two different snapshots. Comparison is not applicable”.
- Where both values are zero, the table shows “No value to display. No AFP or enhancement have been computed for these snapshots”.
Critical Violations
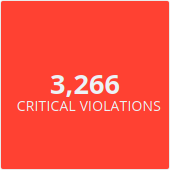
A violation is critical when the rule it breaks is marked critical in the quality model used for the analysis. These rules identify risks likely to affect application operation (Robustness, Efficiency, Security) or development activity (Changeability, Transferability).
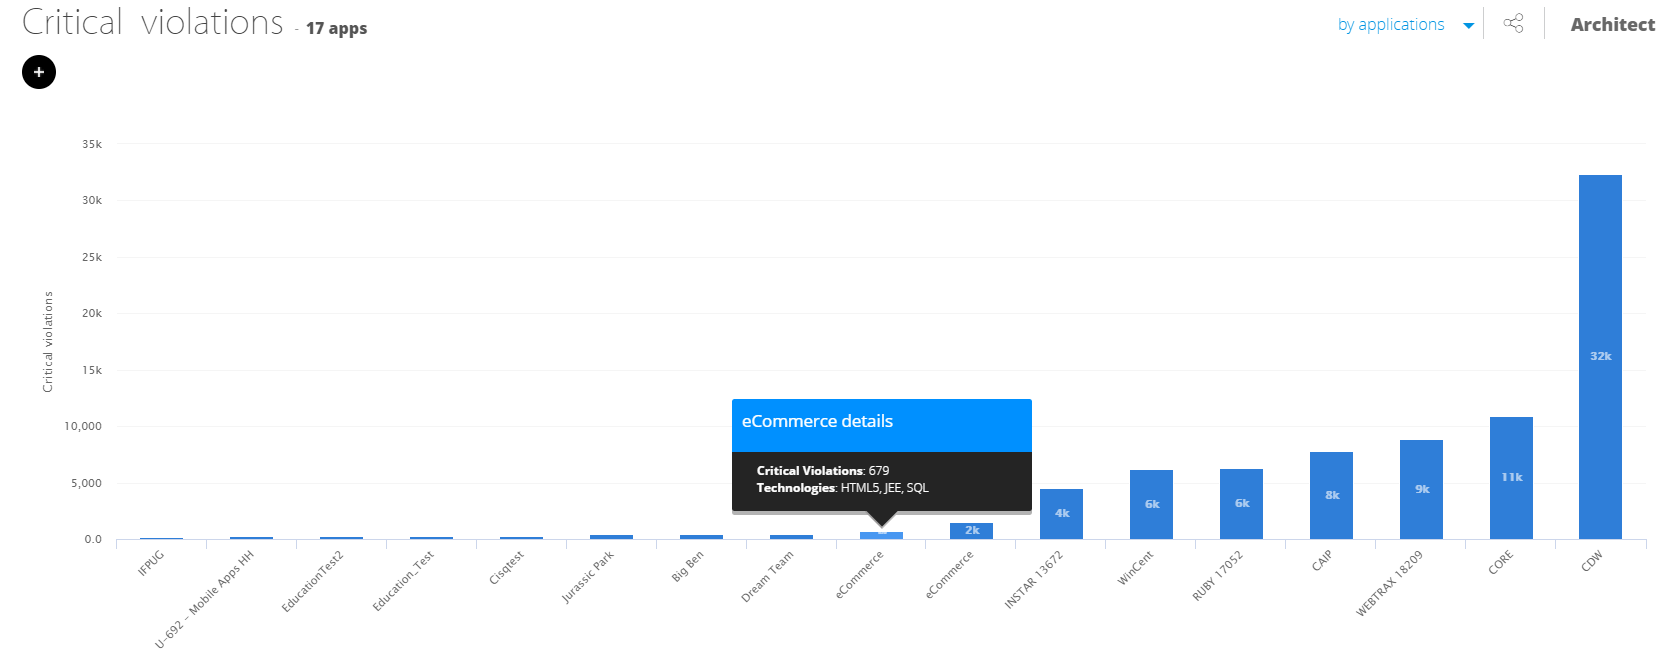
Clicking the tile graphs critical violations across all applications at multi-application level, or for the selected application at single-application level:
Application Mapping
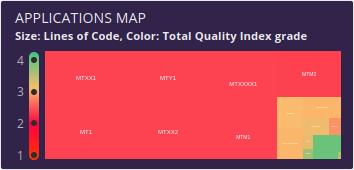
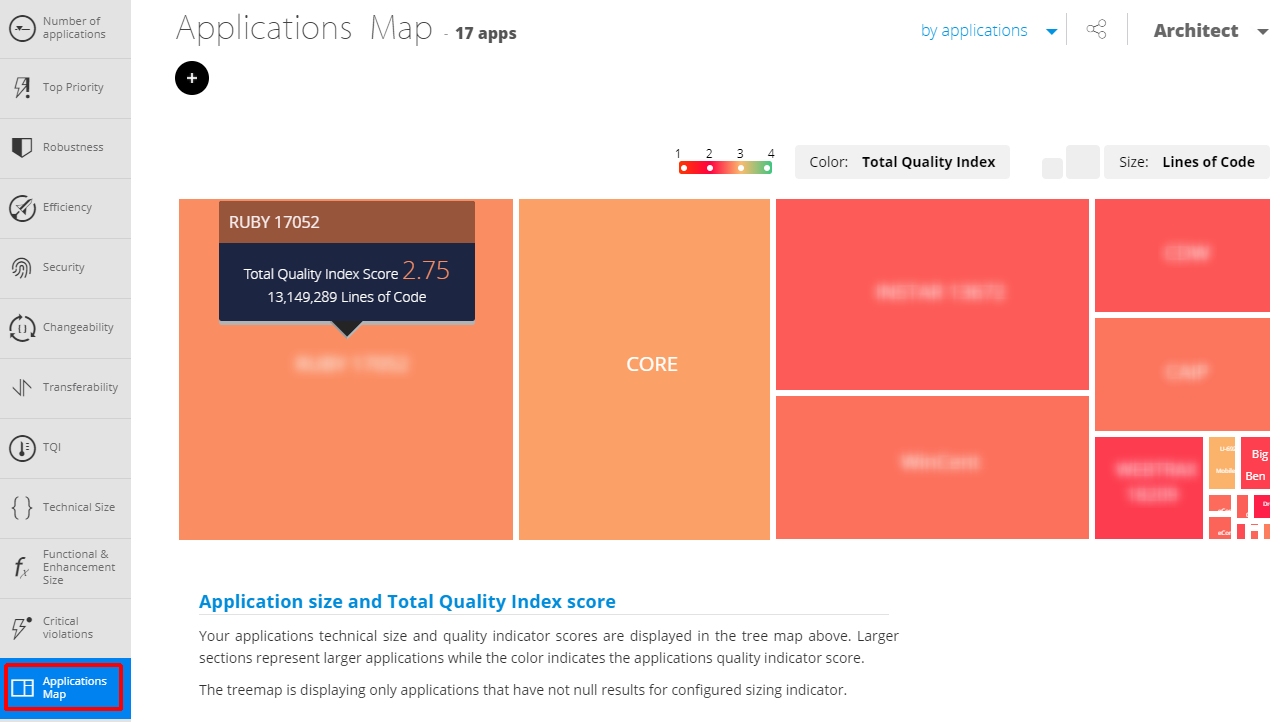
Multi-application level only. Every application appears as a rectangle: its size is the lines of code, its colour is the TQI grade, running from red at 1 to green at 4.
Clicking the tile opens the full map. Roll over an application name for its detail, or click it to open that application’s landing page:
Modules Mapping
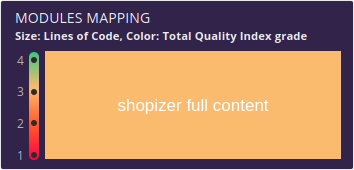
Single-application level only. Each module appears as a rectangle sized by lines of code and coloured by TQI grade. Selecting a module in the module selector outlines it in the treemap.
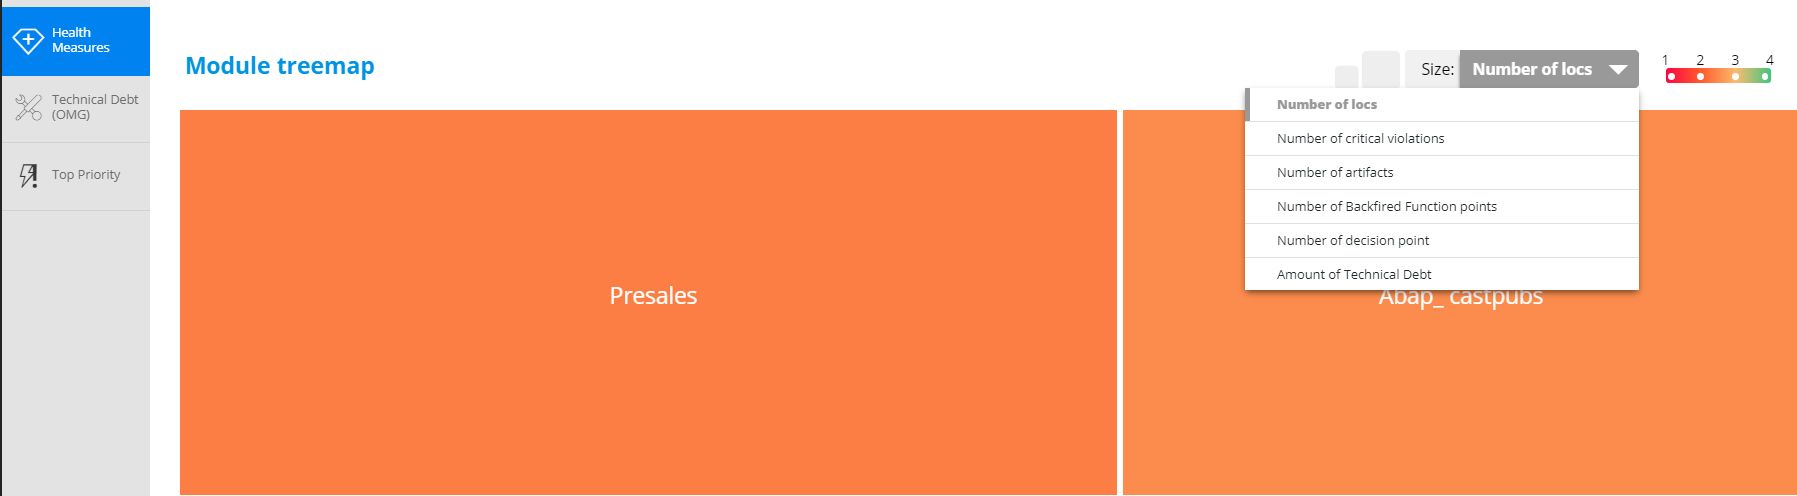
Clicking the tile opens the full map. Roll over a module name for its detail, and use the drop-down to change which sizing measure drives the mapping - lines of code by default. Colour then reflects the grade for the selected measure, red at 1 to green at 4:
Technologies Overview
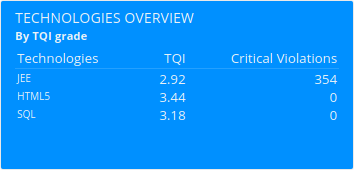
Single-application level only. Lists the TQI grade and the number of critical violations for each technology present in the application.
Technical Debt
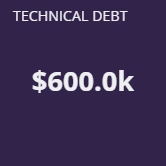
The cost of fixing the structural quality problems that put the business at risk if left unfixed. Like financial debt it accrues interest, in the form of the extra effort needed to maintain and enhance code that carries structural flaws.
Clicking the tile lists Technical Debt across all applications, or for the selected application.
Technical Debt (OMG)
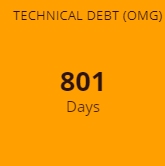
The effort required to fix those problems, expressed in man-days. This tile only carries data when the OMG Technical Debt extension was installed before the snapshot was generated.
Depending on the extension version installed, the value is either CTDM (Contextual Technical Debt Measure, extension 2.x) or ATDM (Automated Technical Debt Measure, extension 1.x). Both are OMG standards submitted by the CISQ Consortium , implementing the OMG Technical Debt Measure to estimate future corrective maintenance cost as described in the OMG ATDM specification 1.0 . CTDM is a union of the default and ISO-5055 index measures.
To switch the Technical Debt (OMG) value between the default and ISO-5055 measures, use the assessment model switch on the home page:

Top Priority
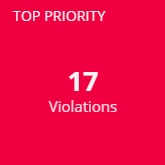
Shows the total number of violations of rules carrying the tag AIP-TOP-PRIORITY. These rules are considered more urgent than those merely marked critical, and should be fixed as soon as possible. The tag is typically applied by the System Level Rules extension, though other rules may carry it too.
This tile requires the Quality Standards Mapping and System Level Rules extensions to be installed before the snapshot is generated. It is also not provided out of the box: an administrator must configure the tile - see QualityStandards.
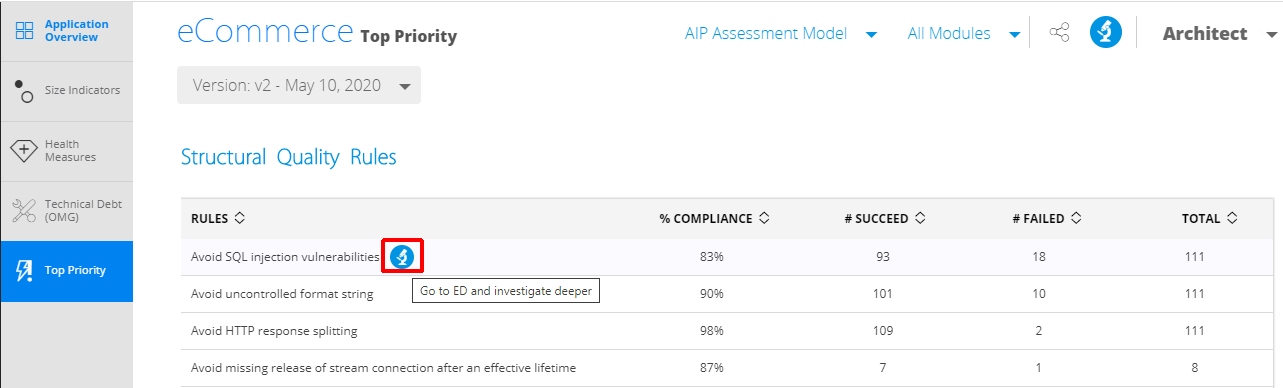
At single-application level, clicking the tile lists every rule flagged with the tag. The microscope icon opens the Engineering Dashboard, where the rule can be investigated further and added to an action plan for remediation:
Top 5 Riskiest Applications
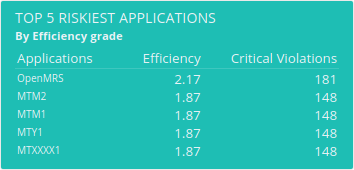
Multi-application level only. Ranks applications by their number of critical rule violations, those rules being the ones whose violation is most likely to have severe impact.
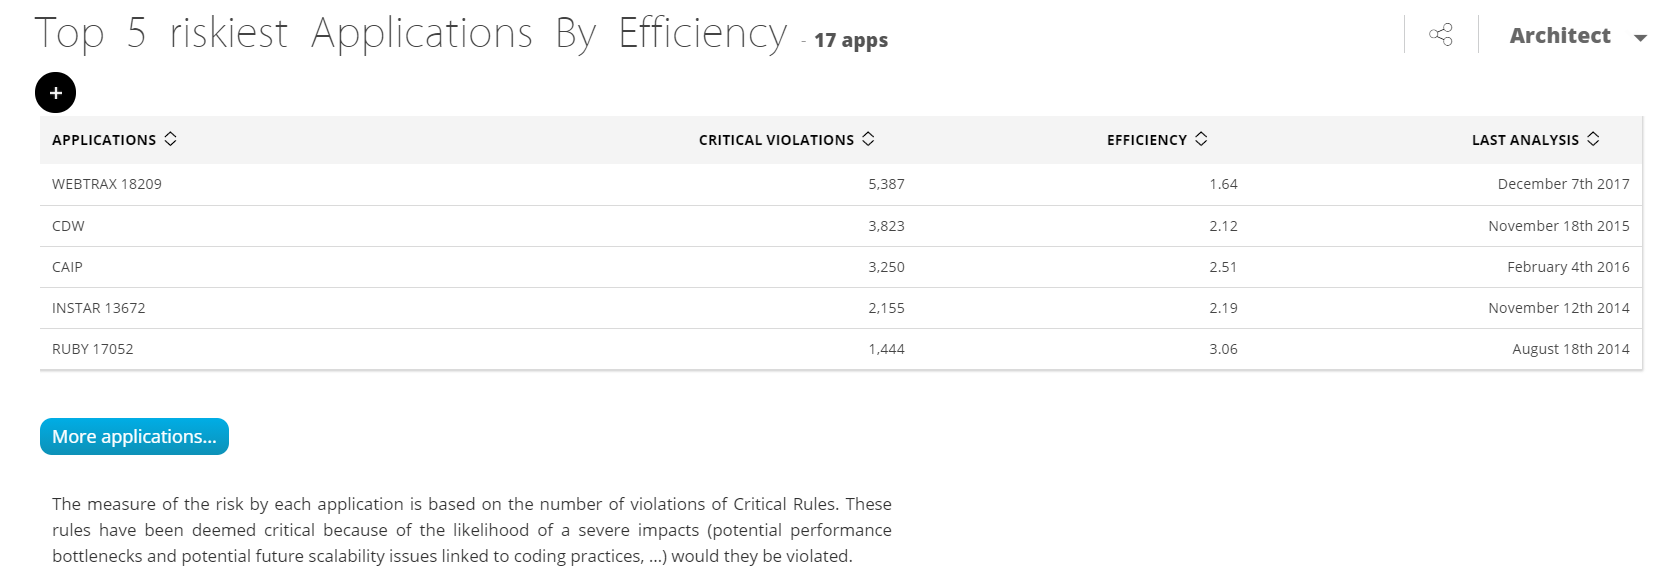
Clicking the tile lists every application with its critical violation count, efficiency grade and last analysis date:
Top Critical Rules
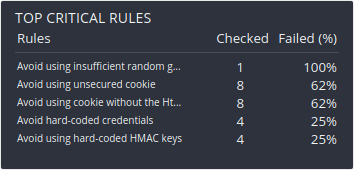
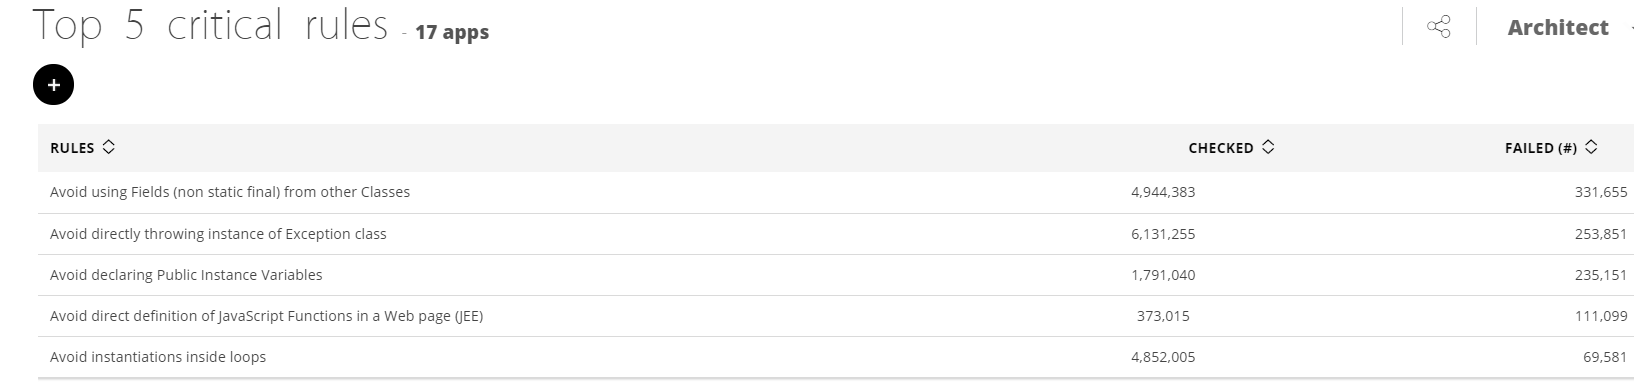
Clicking the tile at multi-application level lists the top five critical rules. Drill-down is not available at single-application level.
Top Riskiest Modules
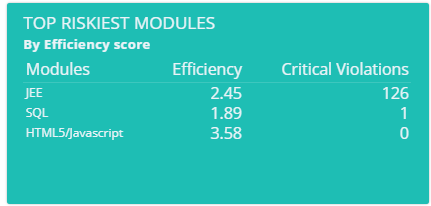
Single-application level only. Lists the riskiest modules in the application. Clicking the tile shows the grade detail as a graph: