The Engineering Dashboard home page
Overview
The application home page is a grid of tiles, each summarising one aspect of the most recent snapshot and each acting as a shortcut into the view that explains it.
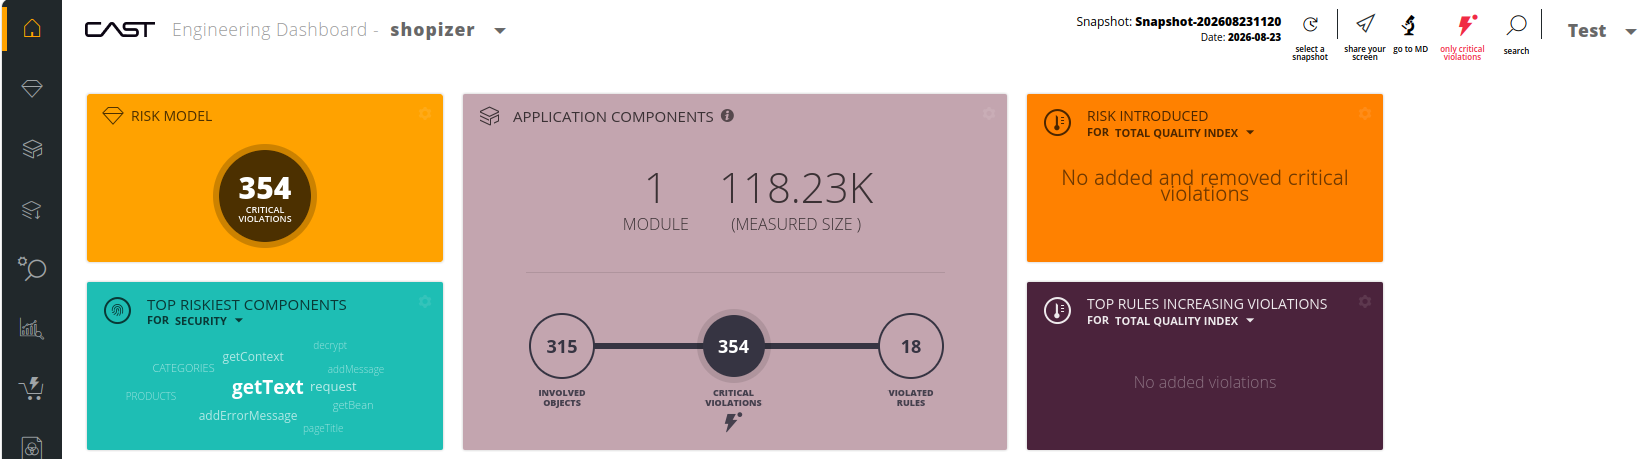
This page describes the default home page. Which tiles appear, what they report, and how they are positioned and sized are all defined in a configuration file, so an administrator can add tiles, remove them or rearrange the grid - see Engineering and Security Dashboard tiles. Your home page may therefore not match the set described here.
Most tiles also respond to the critical violations filter, so the counts change depending on whether the filter is on.
The tiles
Every tile is a shortcut into the view that explains it:
| Tile | Clicking it opens |
|---|---|
| Risk Model | Risk investigation |
| Application Components | Application investigation |
| Risk Introduced | Risk investigation, added and removed violations only |
| ISO-5055 | Risk investigation, scoped to the ISO-5055 assessment model |
| Top Riskiest Transactions | Transaction investigation |
| Top Riskiest Components | Application investigation |
| Weaknesses and Strengths | Risk investigation, at the technical criterion |
| Technologies Overview | Risk investigation, with the technology selected |
| Top Modules with Violations | Application investigation, at the module |
| Action Plan | The Action Plan |
| Exclusions | The Exclusions list |
| Top Rules with increasing or decreasing violations | Risk investigation, at the rule |
| Continuous Improvement | The Improvement tab |
| Architecture Model Violations | Risk investigation, at the rule |
Risk Model
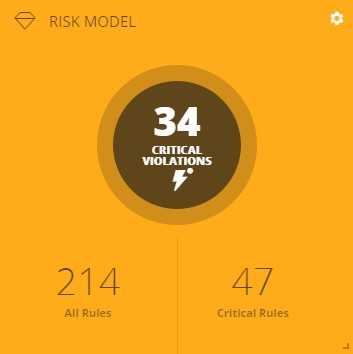
The current state of the application in three numbers:
- The number of violations, or critical violations while the filter is on.
- The number of rules triggered during the analysis. This includes rules delivered with CAST extensions and custom rules, which carry IDs above 1,000,000.
- The number of critical rules triggered.
Application Components
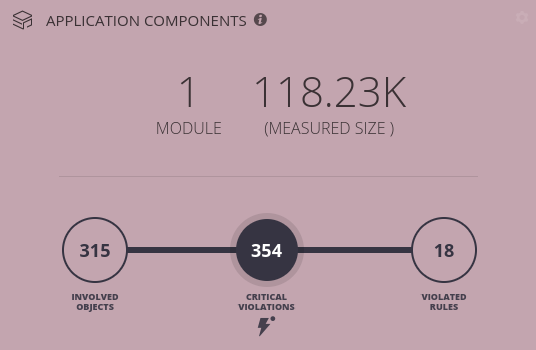
The violation picture expressed in terms of the application’s structure. Across the top:
- Module - the number of modules, configured during analysis to divide the application into meaningful groups.
- The lines of code, reported as Application Size and Measured Size. These are the same two measures the Management Dashboard shows on its Technical Size tile - see Technical Size for what each counts and why neither matches a third-party line counter. Where only one of the two has been produced, the tile shows that value alone.
And in the three circles beneath:
- Involved Objects - objects carrying at least one violation.
- Critical Violations, or Violations with the filter off - the number of times any rule has been violated by an object.
- Violated Rules - the number of rules that have been violated.
Risk Introduced
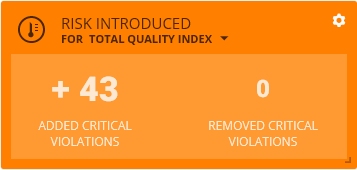
How risk moved between the previous snapshot and this one, for one Health Measure:
- Added violations, the risk introduced in this snapshot.
- Removed violations, the risk taken out.
TQI is shown by default and can be changed from the drop-down in the tile. On a first snapshot there is nothing to compare against, so there will be additions but no removals. Where there are neither, the tile shows no data and is not clickable.
The view this tile opens shows only added and removed violations. Any Health Measure, technical criterion or rule where both counts are zero is hidden, and the view says so.
ISO-5055
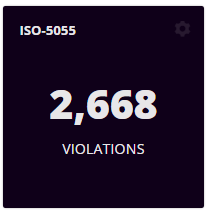
ISO-5055 results with full drill-down, scoped to the ISO-5055 assessment model and its metrics.
This tile is absent unless the ISO-5055 extension is installed for the application.
Top Riskiest Transactions
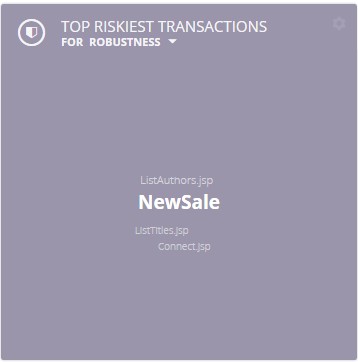
A clickable cloud of transaction names, sized and weighted by TRI (Transaction Risk Index), an indicator of how much risk a transaction carries within the selected Health Measure. Robustness is the default and can be changed in the tile.
Clicking a name opens that transaction’s parent Health Measure in Transaction investigation.
Top Riskiest Components
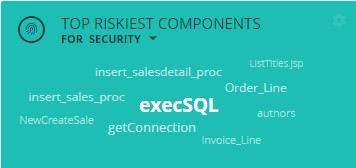
The same idea for objects rather than transactions, sized by Risk - previously called PRI, the Propagated Risk Index. Security is the default Health Measure and can be changed in the tile.
Clicking a name opens that object in Application investigation.
Weaknesses and Strengths
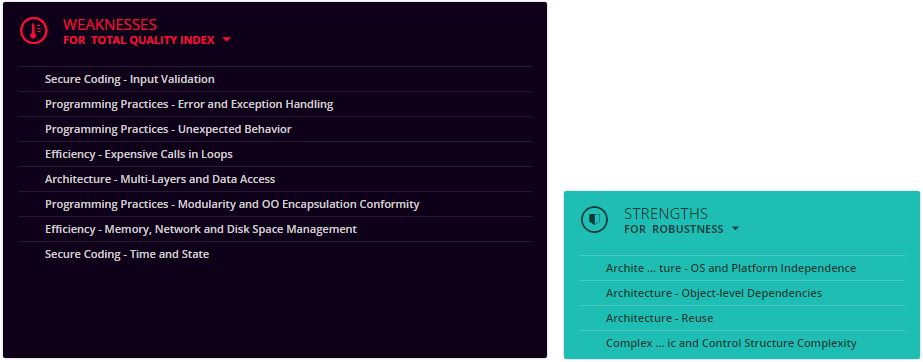
Two tiles that split the technical criteria of a Health Measure in two:
- Weaknesses are the technical criteria with at least one critical violation, sorted worst first.
- Strengths are those with none. That includes criteria with no critical rules at all, and criteria whose critical rules were not violated.
Robustness is the default for both, and can be changed per tile. Clicking a technical criterion opens it in Risk investigation.
Technologies Overview
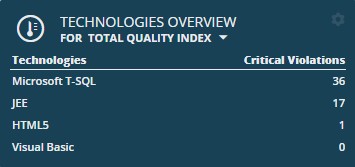
Violation counts broken down by technology, for one Health Measure - TQI by default. Clicking the tile opens Risk investigation with the corresponding technology already selected. Drill-down is disabled where the tile shows N/A.
Top Modules with Violations
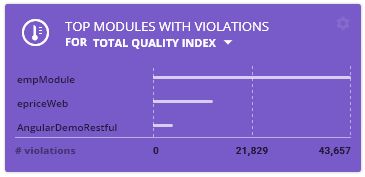
Modules ranked by violation count, for one Health Measure - TQI by default. Resize the tile to show more or fewer modules. Clicking a module opens it in Application investigation, where the violated rules are listed by violation count with critical rules first.
Action Plan
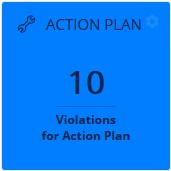
Initially the number of objects added to the Action Plan since the last snapshot was generated. Resize the tile to include the Pending and Solved figures as well.
Exclusions
Two counts, and the difference between them matters:
| Count | Meaning |
|---|---|
| Active Exclusions | Violations added to the exclusion list and covered by a snapshot generated since. They are genuinely excluded from the current results |
| Scheduled Exclusions | Violations added to the list but not yet covered by a new snapshot. They still count towards the current results, and move to Active when the next snapshot is generated |
Top Rules with increasing or decreasing violations
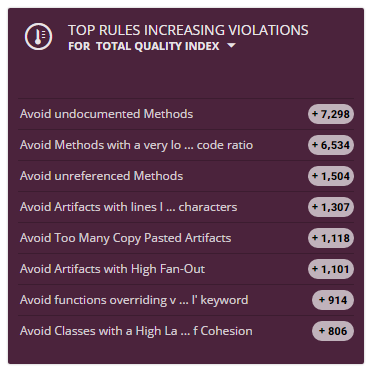
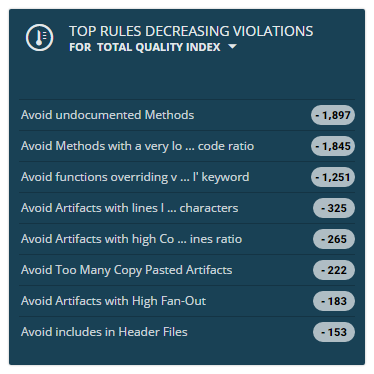
Two tiles ranking rules by how much their violation count moved between the previous snapshot and this one. The value on the right of each rule is the size of the change, so the rules at the top of each list moved most. A red dot marks a critical rule, and each rule is clickable through to Risk investigation.
Because the dashboard filters to critical violations by default, these tiles show only critical rules until you turn the filter off.
Continuous Improvement
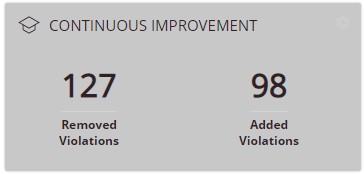
Violations added and removed in the current snapshot. The tile is empty when an earlier snapshot is selected. Clicking it opens the Improvement tab.
Architecture Model Violations
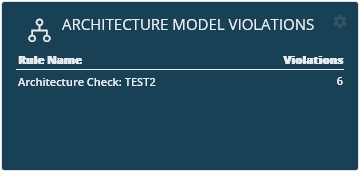
Every architecture model assigned to the application and checked during the snapshot, with its violation count. Clicking a rule opens its detail in Risk investigation. A model with no data for the snapshot shows n/a, and architecture rules are not available for earlier snapshots.
This tile is not provided out of the box and must be configured - see ArchitectureModel.
Arranging the home page
Tiles can be moved by dragging them, and many can be resized by dragging the bottom right corner. Tiles carry minimum and maximum sizes, so some will refuse to resize beyond a point by design.
Layout, tile colours, bookmarks and language are all stored in the browser, not against your user account. They persist between sessions in the same browser, are invisible to other users, and are lost if the browser cache is cleared.
Resetting
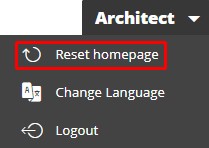
Reset homepage, in the user menu, restores the out-of-the-box position, size and colour of every tile. It also returns the critical violations filter to its default.
Bookmarking a rule
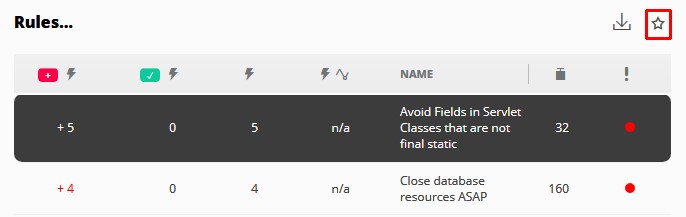
To watch one rule from the home page, navigate to it, select it, and click the star icon:
The rule then appears as its own tile showing the violation count, whether the rule is critical, and where applicable how the count has evolved since the previous snapshot:
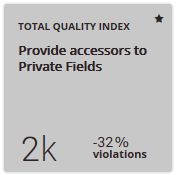
Bookmark tiles carry a star in the upper right corner. Roll over the star and it becomes a cross, which removes the tile.
Only a rule can be bookmarked. Health Measures, technical criteria, distributions and measures cannot.
Changing tile colours
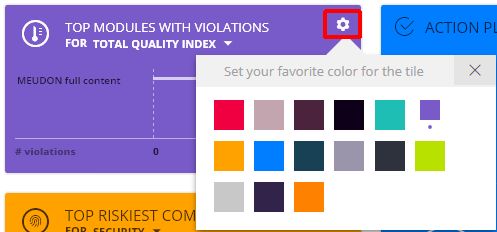
Click the cog in the corner of any tile and pick a colour:
Top menu bar

| Item | What it does |
|---|---|
| Application selector | Switches application. Only applications you are authorized to see are listed |
| Snapshot description | The name, version and date of the snapshot you are looking at |
| Snapshot selector | Switches to an earlier snapshot - see Looking at an earlier snapshot for what becomes unavailable |
| Share | Opens a new email in your mail client containing a link to exactly where you are in the dashboard |
| Go to Management Dashboard | Opens the same application in the Management Dashboard |
| Data filtering | Toggles the critical violations filter |
| Search | Searches for items in the assessment model by name |
| User menu | Reset homepage, Change Language, Logout, and for administrators the user configuration interface |
Side menu bar

| Icon | Opens |
|---|---|
| Home | This page, from anywhere in the dashboard |
| Risk investigation | Risk investigation |
| Application investigation | Application investigation |
| Transaction investigation | Transaction investigation |
| Advanced search | Search for an object by name across a list of violations, with filters to narrow the scope |
| Education / Continuous Improvement | Those two features, opening on Education |
| Actions / Exclusions | Those two features, opening on the Action Plan |
| Report generation | The in-dashboard reports |
| Contextual help | Turns on inline help. Anything with help configured gains a plus sign in a blue circle; click it to read the explanation |
| What’s new | The release information for the dashboard |
Changing the display language
The dashboard ships in English. Where an administrator has configured a translation, Change Language in the user menu offers the available locales. Only configured locales appear.
Reports can also be generated in German, Italian, Spanish, French and Chinese. To get a report in one of those, set the dashboard language first, then generate the report.