Continuous improvement
Overview
Continuous improvement is the reporting half of the education list. Whatever rules you put on that list, this view shows how their violations have moved over successive snapshots - whether the team is actually getting better at them.
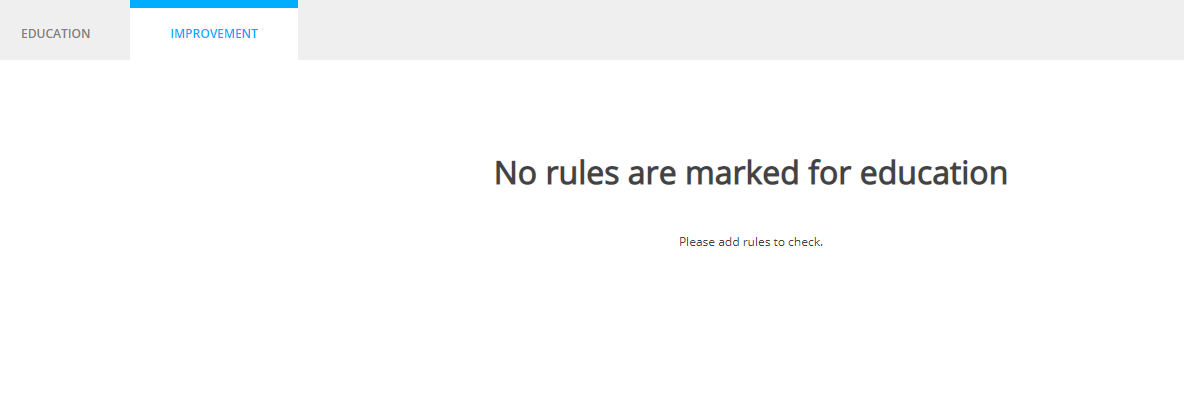
It only shows rules from the education list, so an empty education list means an empty page here:
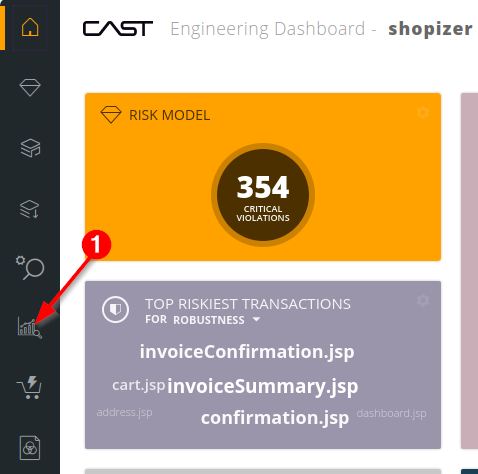
Reach it from the sidebar’s Education and Continuous Improvement icon, which opens on Education - switch to the Improvement tab:
No data can be shown while an earlier snapshot is selected: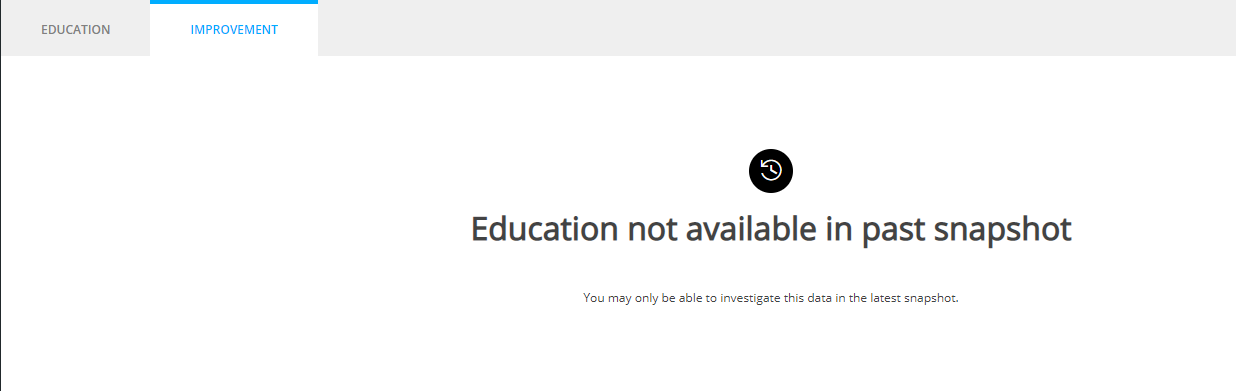
Choosing what to show
Two controls drive everything on the page.
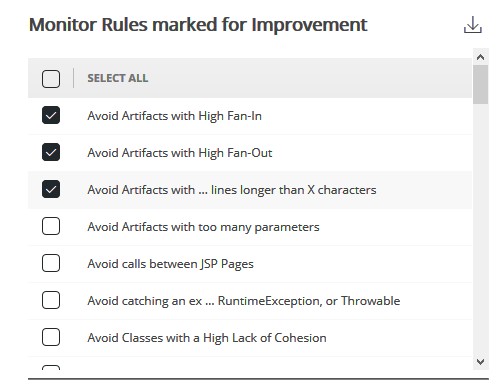
The rule selector, top right, lists every rule on the education list. Selecting and deselecting rules changes the statistics, the graph and the table beneath:
The violation status, bottom right, decides what the graph plots:
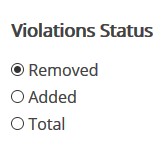
The three statuses
| Status | The graph shows |
|---|---|
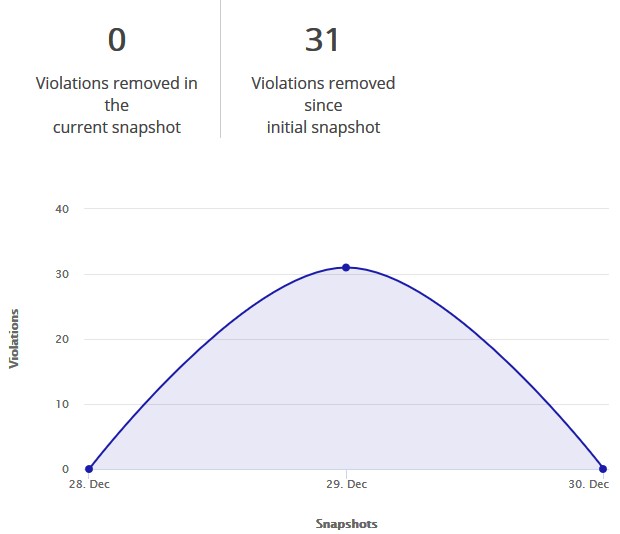
| Removed | Violations removed in the current snapshot, and removed since the initial snapshot |
| Added | Violations added in the current snapshot, and added since the initial snapshot |
| Total | Violations in the current snapshot, the percentage increase since the initial snapshot, and the percentage increase since the previous snapshot |
Removed:
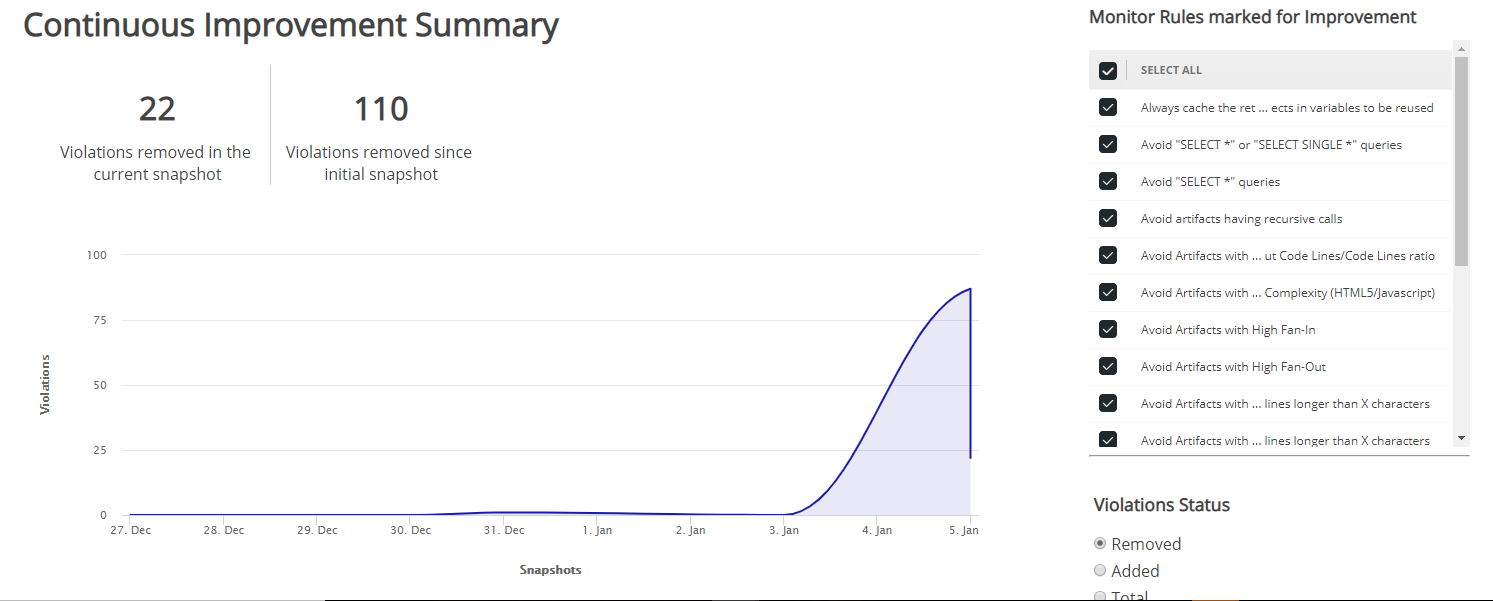
Added:
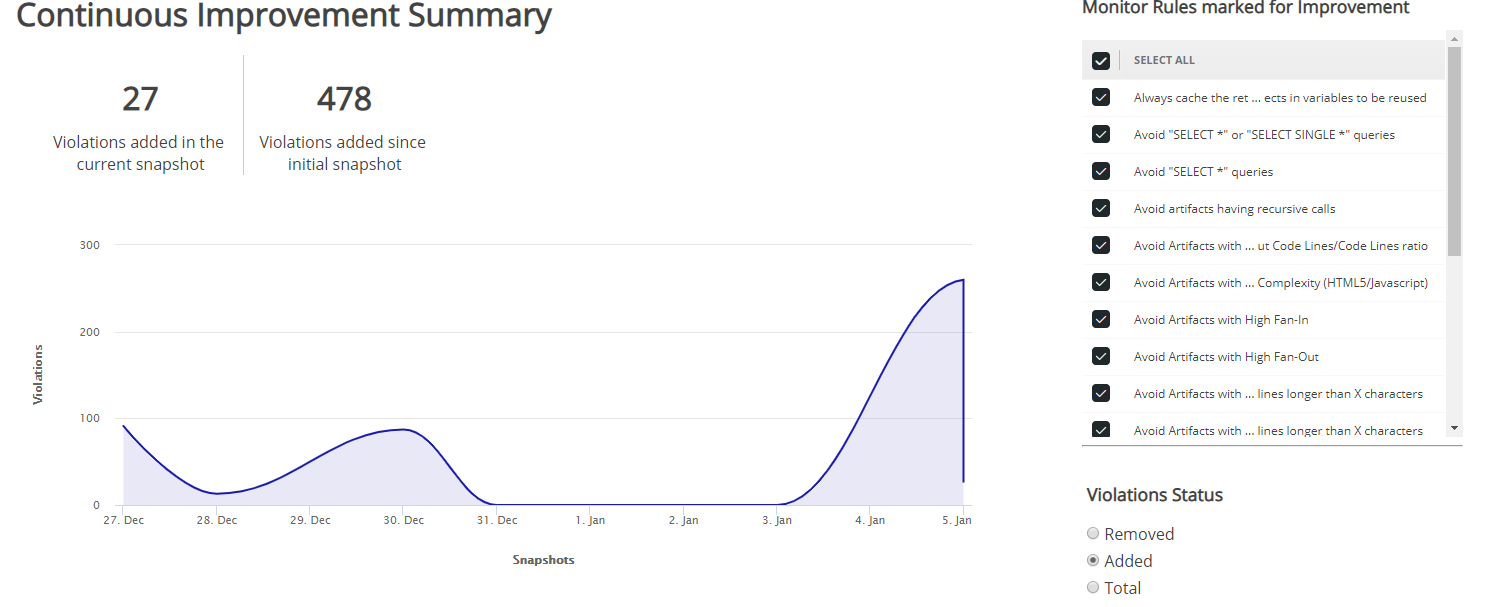
Total:
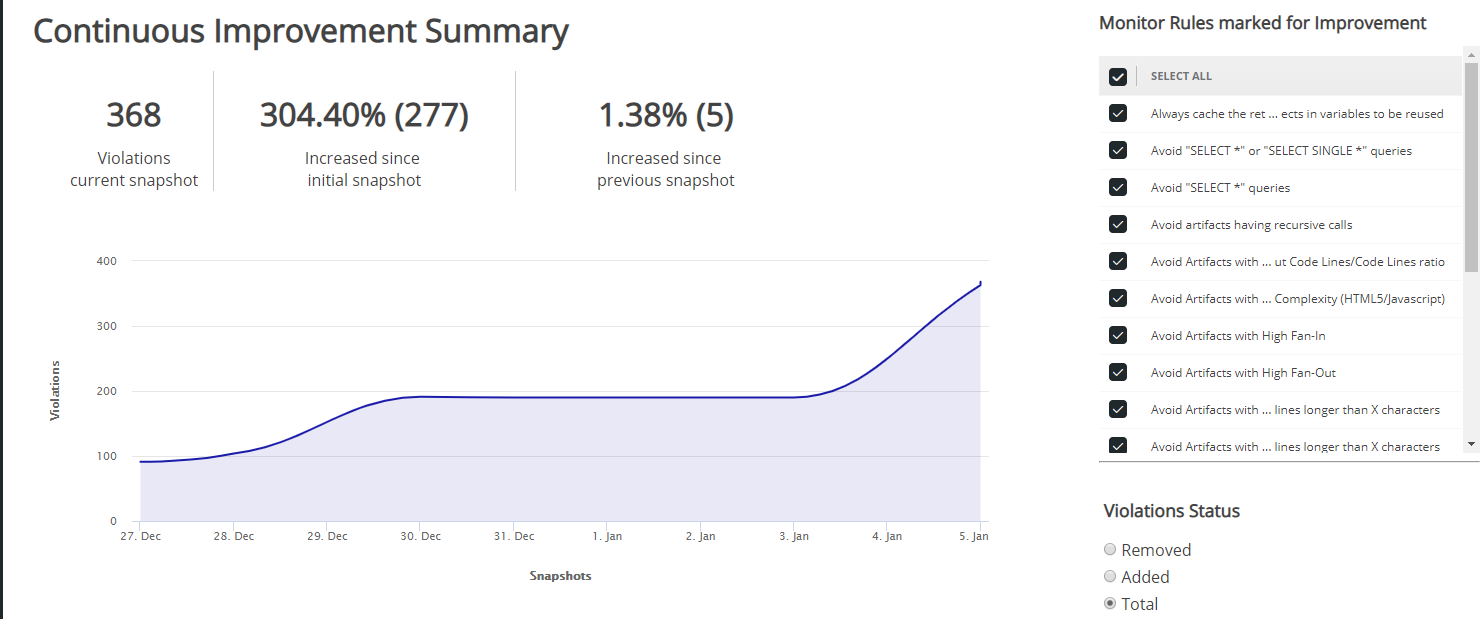
In every case, hovering over a point on the graph gives the violation count, the snapshot version and the snapshot date.
The graph and the table
The graph plots violation count against snapshot date, with an improvement summary above it:
Beneath it, the violations in the current snapshot for the selected rules:
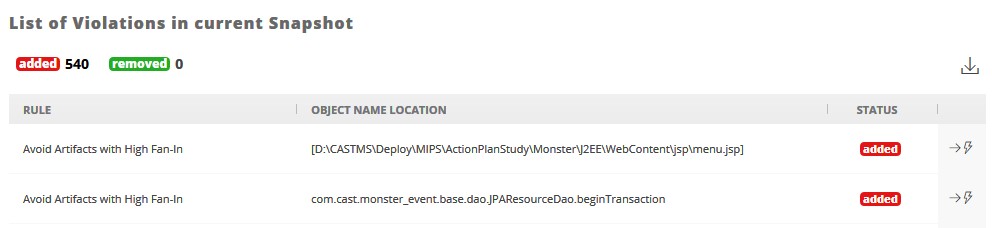
Only 10 violations load initially, with SHOW MORE to add more and a default ceiling of 5000 on All - configurable, see violationsCount.
The rules can be exported to Excel - see Exporting data.