Monitor and manage analysis jobs
Overview
The Job Monitor shows in one place everything CAST Imaging is doing or has recently done: which jobs are running, which are waiting to start, and which have finished and how they ended. It also shows the analysis nodes doing the work and how busy each one is. Use it to find out why a job has not started, which node ran it, or why it failed, and to move a job further up the queue.
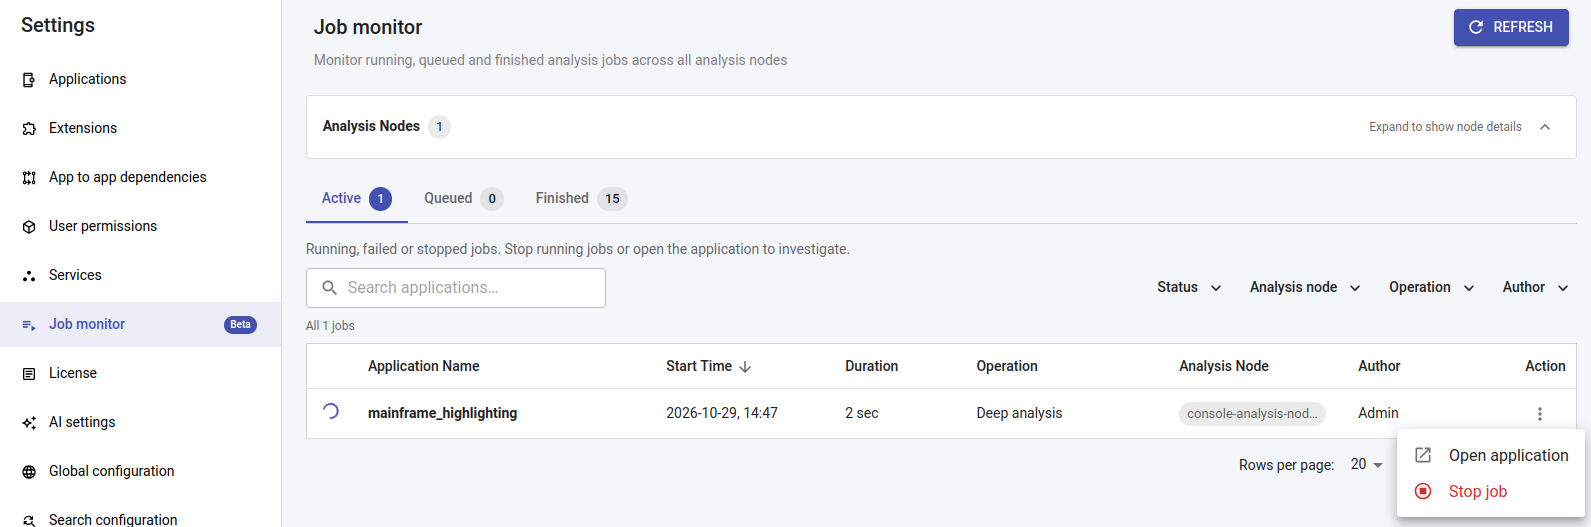
The Job Monitor is available only to users with the Admin profile, or a custom profile with the Administrator role. It is currently a beta feature and is marked Beta in the Settings menu.
Open the Job Monitor
Use either of these:
- Navigate to Settings > Job monitor:
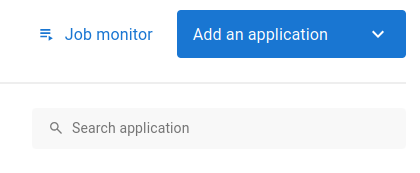
- Click Job monitor on the landing page, next to Add an application:
Check analysis node capacity
The Analysis Nodes panel at the top of the page shows the total number of analysis nodes. The panel is collapsed by default: click Expand to show node details to see how much of the total capacity is in use and the details for each node. For example, 3 / 8 jobs running means three jobs are running across eight available slots.

| Column | Description |
|---|---|
| Node | The analysis node’s name |
| Running | The number of jobs the node is running now against its capacity, for example 2 / 3. The load bar turns orange at 75% of capacity and red at 100% |
| Max parallel jobs | The maximum number of jobs the node can run at the same time |
| CPU / Memory / Disk | Current resource usage on the node: CPU as a percentage, memory and disk as used / total GB |
If a node’s capacity shows Unknown, CAST Imaging cannot read it: the node may be unreachable or still starting. Check that the node is running, then click Refresh. You can still set a Max parallel jobs value for the node.
Change the number of jobs a node runs at once
- Click the Max parallel jobs value for the node.
- Enter a number from 1 to 20. To set every node to the same value, select Apply this value to all [N] nodes.
- Click Save.
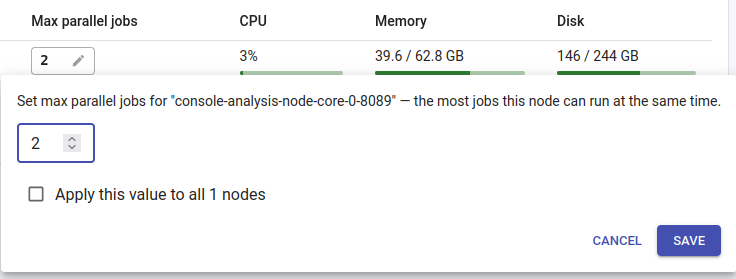
The change takes effect immediately and no restart is required. The value is saved for each node, so it is kept when the node restarts.
The value set in the node’s configuration file (see Configure parallel analyses) is used as the default. When you update an installation that uses a custom value, the Job Monitor displays that value after the update. Once you change the value in the Job Monitor, it takes precedence over the configuration file.
Each additional parallel job competes for the same CPU, memory and disk on the node. Increase the value one job at a time and watch the CPU, Memory and Disk columns. To add capacity without overloading a node, add another analysis node instead.
Work with jobs
Jobs are split across three tabs.
Active
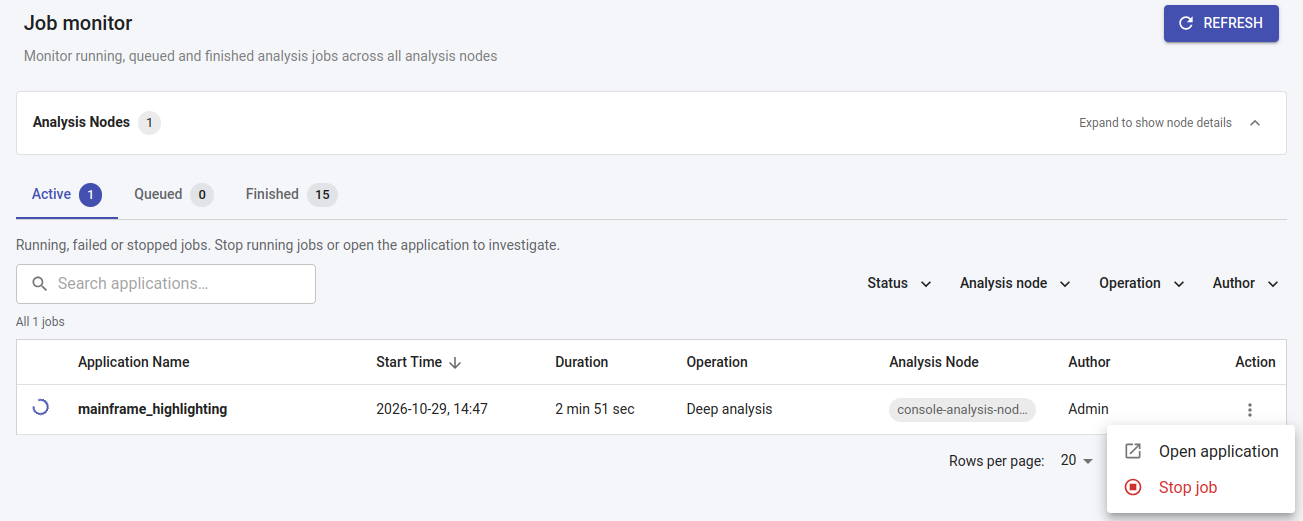
The Active tab lists jobs that are running, plus jobs that failed or were stopped. Failed and stopped jobs are listed in the Finished tab as well, so they appear in both tabs. Successful jobs appear only in the Finished tab. Running jobs are always listed first, whichever column you sort by, so a long-running job is never pushed off the page by more recent failures. The Active tab label shows two counts: running jobs, and failed or stopped jobs (in red).
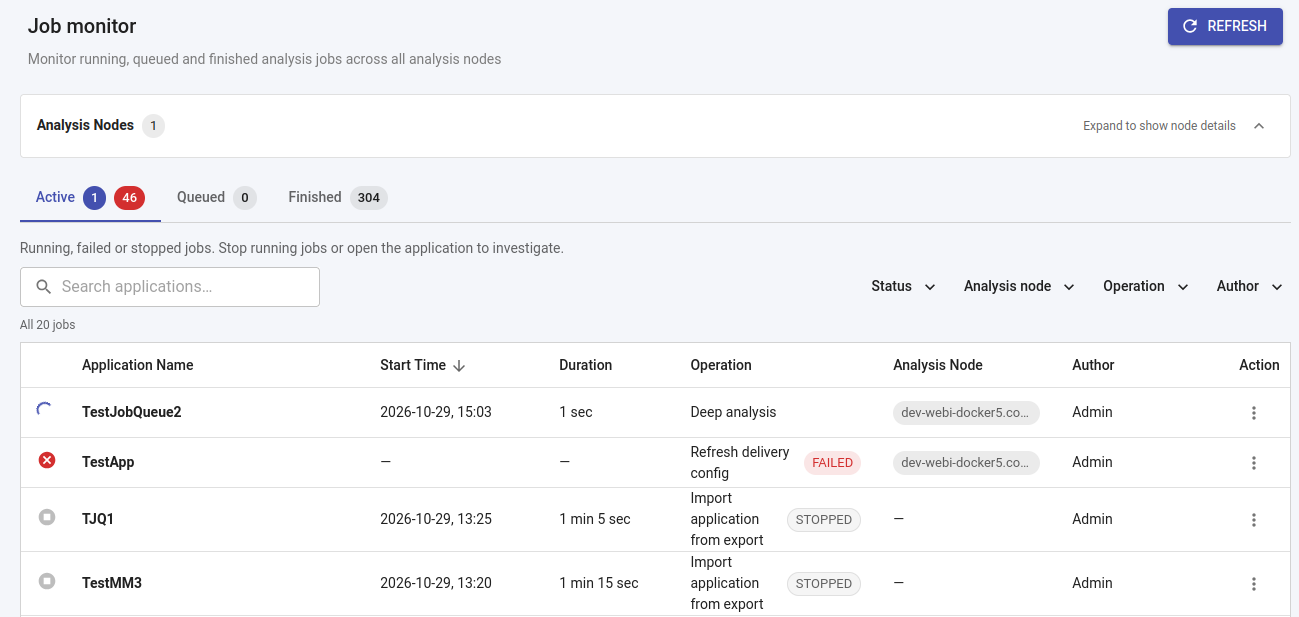
Columns: status icon, Application Name, Start Time, Duration, Operation, Analysis Node, Author, Action. Failed and stopped jobs carry a FAILED or STOPPED label next to the operation. A job that failed before it started has no start time or duration.
The Action menu on each row offers:
- Open application: go to the application to investigate the job.
- Stop job: stop a running job. After you confirm, the job’s status changes to Failed or Stopped.
Failed and stopped jobs offer only Open application.
Queued
The Queued tab lists jobs waiting for a free slot. When any node has capacity, it picks up the next job in this list, so the list order is the order in which jobs start. The job at the top is marked Next.
Columns: Order, Application Name, Operation, Author.
To change the order, drag a row to a new position, or use the row’s Action menu and select Move to top or Move to bottom. The new order is saved immediately and applies to every node. Keep in mind that:
- You can reorder only the full, unfiltered queue. While a search or filter is active, drag and drop is disabled and the page displays Clear the search and filters to drag and drop. This prevents you from moving a job next to a row that is not actually its neighbor in the queue.
- A job that has already started is no longer in the queue and cannot be reordered.
To remove a queued job before it starts, select Cancel job in its Action menu.
Finished
The Finished tab lists completed jobs, newest first. The Result column shows Success, Failed or Stopped. Failed and stopped jobs are also listed in the Active tab, so they stay visible alongside running jobs. Successful jobs are listed only here.
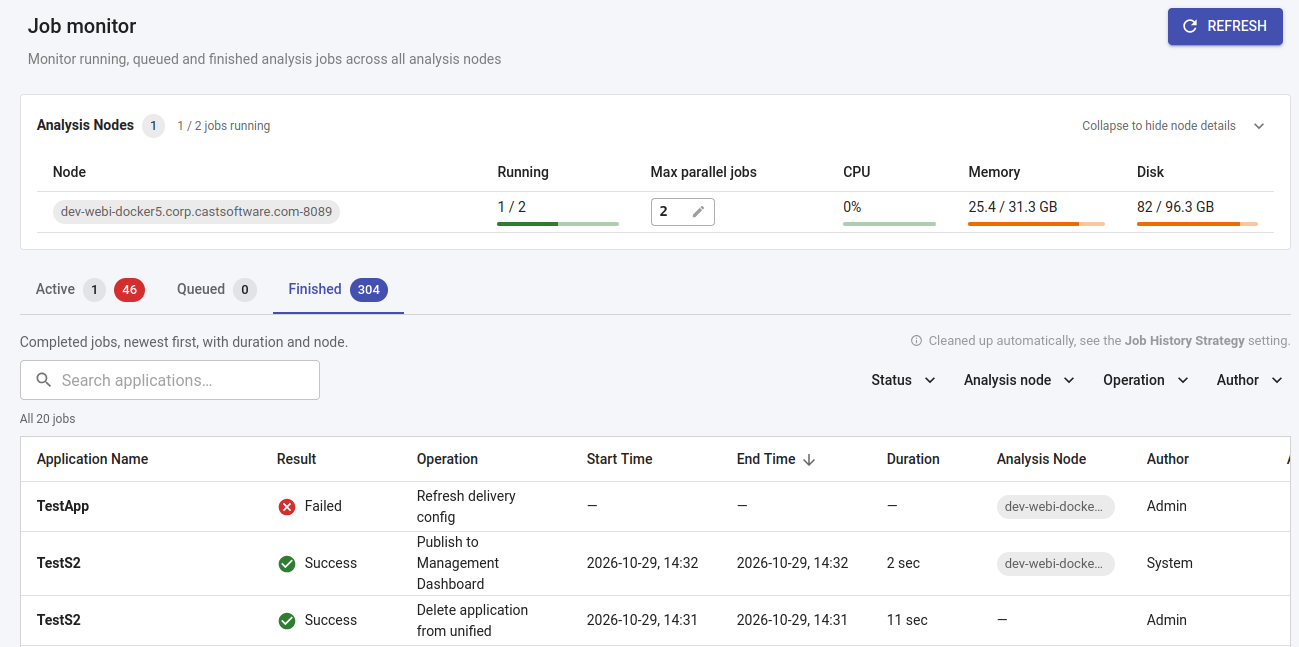
Columns: Application Name, Result, Operation, Start Time, End Time, Duration, Analysis Node, Author, Action. Jobs that CAST Imaging runs automatically, such as publishing to the Management Dashboard after an analysis, show System as the author.
Finished jobs are removed automatically over time. The Job History option controls how many are kept.
Find jobs
Each tab has a search box, which matches application names, and a set of filters. Filters apply to the whole job history, not only the rows on the current page, and the count below them shows how many jobs match. Click Clear filters to reset them.
| Filter | Active | Queued | Finished |
|---|---|---|---|
| Status | Running, Failed or Stopped | - | Success, Failed or Stopped |
| Analysis node | ✓ | - | ✓ |
| Operation | ✓ | ✓ | ✓ |
| Author | ✓ | ✓ | ✓ |
Filters are multi-select: when you select several nodes, operations or authors, jobs matching any of them are shown.
- No analysis node: this option in the Analysis node filter finds jobs that never had a node assigned, either because they are still waiting to be picked up or because they failed before a node took them.
- Operation names are the same as those used in the application logs, so a job has the same name in both places.
To sort the Active or Finished tab, click a column heading. The Queued tab cannot be sorted, because its order is the order in which jobs start. Each tab shows 10, 20, 50 or 100 rows per page.
Refresh the page
The page refreshes automatically about every 30 seconds. Click Refresh for an immediate update, for example straight after you stop or reorder a job.
A job that takes less than about 30 seconds can start and finish between two refreshes, so it may appear in Finished without ever appearing in Active.
Troubleshoot common situations
| Situation | Cause and action |
|---|---|
| A job stays in Queued and does not start | Every node has reached its Max parallel jobs limit. Wait, raise the limit on a node, or move the job to the top of the queue. |
| A job shows no analysis node | No node has picked it up yet, or it failed before a node took it. Use the No analysis node filter to find all such jobs. |
| A node shows Unknown capacity | CAST Imaging cannot reach the node. Check that the node is running, then click Refresh. |
| A job is no longer listed in Finished | It was removed automatically under the Job History retention setting. |