Explore a transaction
Overview
A Transaction is a vertical call graph that runs from an input (an interface, batch, web UI element and so on) down to an output (a table, file, API call and so on). A Data Call Graph is the reverse - it runs from an output back to an input. Both are calculated automatically during analysis and let you follow a single end-to-end flow through the application rather than the whole graph.
When to use this
Use this when you want to understand one specific flow - for example, what a given entry point does, which objects it passes through, and where it ends.
How to explore a transaction
- Select the scope. In the left panel, choose the Transaction (or Data Call Graph) scope. Each transaction or data call graph can be selected individually as a perimeter.
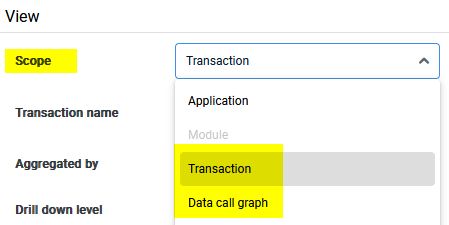
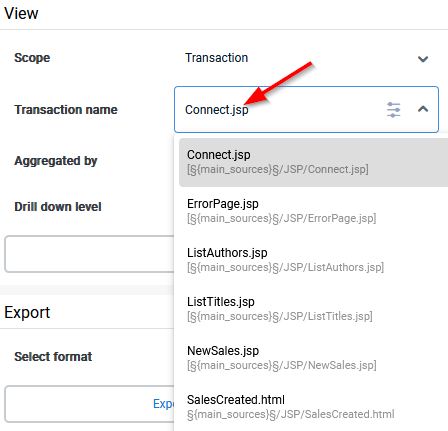
- Find the one you need. Use the Custom view search to locate a specific transaction or data call graph, and to filter by the objects, links, technologies, tags, or post-its it contains.
- View the flow. Open the transaction to display its graph. Drill down to object level to see the individual objects and the links between them.
![]()
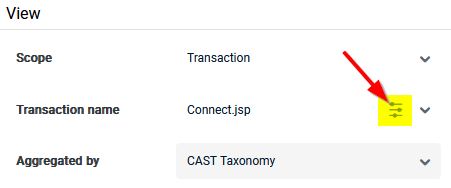
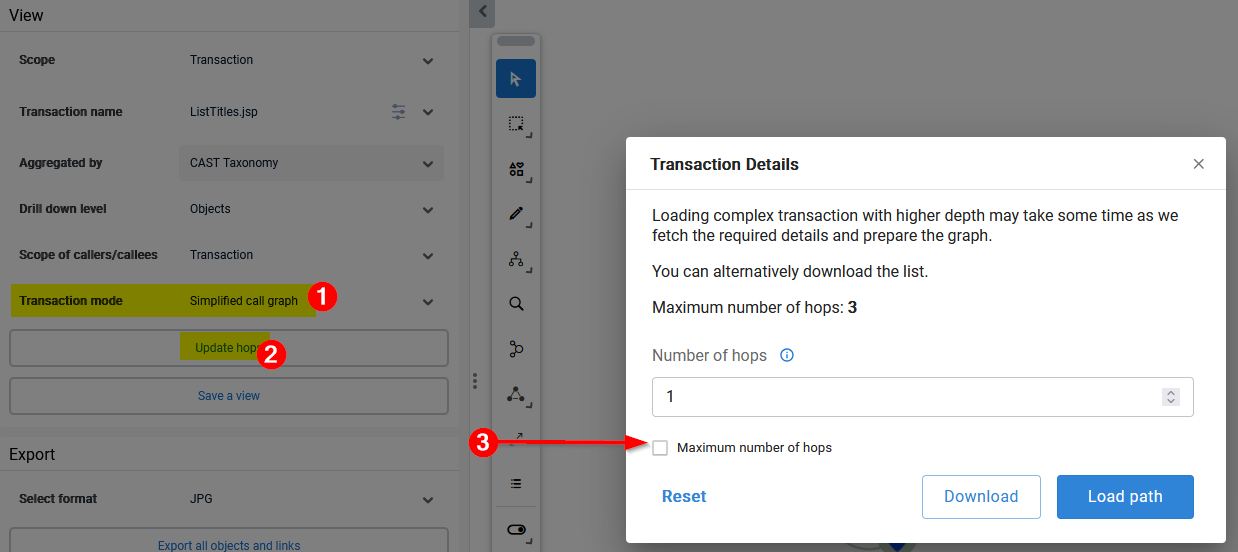
- Choose how much to show. Switch between the call graph display modes (see below) to control how much of the flow is shown, and use the Transaction details / Update start and end points option to set the depth between the source object and the end points - see Graph options and Find start and end points:
Transactions and data call graphs cannot be edited in the viewer, but they can be renamed - see Renaming transactions and data call graphs.
Call graph display modes
A transaction or data call graph can be shown in one of three call graph modes. CAST Imaging selects a mode automatically based on the number of objects in the graph, but you can switch between them from the left panel:
![]()
| Mode | When it is used | What it shows |
|---|---|---|
| Reduced call graph | Selected automatically when the call graph contains fewer than 500 objects. | A filtered view that removes less critical nodes and links (determined during the analysis import) to keep the graph readable and responsive. |
| Simplified call graph | Selected automatically when the call graph contains more than 500 objects. | Only one level of objects, together with the associated start and end points - the most condensed view. Switch to it manually with Show Simplified Call Graph in the left panel. |
| Full call graph | Never shown by default - activate it manually with Full Call Graph in the left panel. | All the objects in the call graph; large graphs may take some time to render. The full call graph cannot be displayed beyond 3000 nodes and 8000 links. |
Clicking the active mode’s button again returns you to the previous mode, so you can move between views as your analysis requires.
The Transaction details / Update start and end points option is available when the Simplified Call Graph is active - see Find start and end points and Graph options.
Related
- Find start and end points - identify the entry and exit points of a transaction.
- Trace a path - find the paths between two specific objects in the flow.
- Custom view search - search within a transaction or data call graph.
- Left panel reference and Graph options - the underlying interface controls.