Green - 1.0
Extension ID
com.castsoftware.greenit
What’s new
See Release Notes - 1.0.
Description
Consider the following:
- IT operations run on electricity
- kWh production leads to CO2 emissions (or equivalent)
- Lack of efficiency in IT operations wastes energy
- Unnecessary CPU cycles = unnecessary kWh consumption
- Efficiency in IT operations is for a large part conditioned by the
way the operation of application was developed
- People have been used to ever-growing computing resources
- Forgetting the impact on the environment through the energy consumption
- Resulting in software that is far from optimized
- Energy can be saved by making software more efficient
With this in mind, CAST has developed a specific indicator called Green (based on CAST’s algorithms and measures) that is designed to show how efficient (on a scale of 1.00 - 4.00, with 4.00 being the best possible score) an Application is. The indicator can help identify pieces of software that could be optimized (by evolving the code) to require less CPU resources.
This index is built on the following rule set:
The underlying technical criteria are the following:
- Complexity - SQL Queries
- Programming Practices - Error and Exception Handling
- Efficiency - Memory, Network and Disk Space Management
- Efficiency - SQL and Data Handling Performance
- Secure Coding - Weak Security Features
- Secure Coding - Time and State
- Efficiency - Expensive Calls in Loops
- Programming Practices - Unexpected Behavior
In what situation should you install this extension?
If you want to know how “green” (i.e. efficient) your Application is, you should install this extension.
Compatibility
| CAST Imaging Core | Supported |
| ≥ 8.3.x |
Prerequisites
| A Dashboard schema containing at least one snapshot for your target application | |
| A Measurement schema containing at least one snapshot for your target application |
Download and installation instructions
The extension will not be automatically downloaded and installed in CAST Imaging Console. If you need to use it, should manually install the extension.
Configuring the CAST Health Dashboard “Green” tile
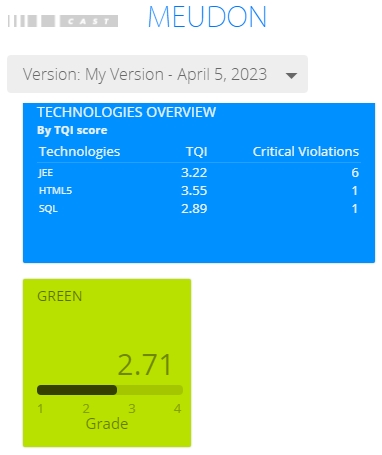
Out of the box, the extension provides a Green Health Measure and Assessment Model, but you must also manually configure a Green tile for the Health Dashboard at single and multi-application level. Clicking on the tile will lead to the Health Factor information:
Step 1 - Modify the cmp.json and app.json files
Modify (using a text editor - Notepad or other similar application) the following files that are part of your deployed CAST Health Dashboard:
Embedded

%PROGRAMDATA%\CAST\Dashboards\<folder>\config\hd\cmp.json
%PROGRAMDATA%\CAST\Dashboards\<folder>\config\hd\app.json

JAR ≥ 2.x

%PROGRAMDATA%\CAST\Dashboards\HD\config\hd\cmp.json
%PROGRAMDATA%\CAST\Dashboards\HD\config\hd\app.json

WAR ≥ 2.x

CATALINA_HOME\webapps\CAST-Health\WEB-INF\classes\config\hd\cmp.json
CATALINA_HOME\webapps\CAST-Health\WEB-INF\classes\config\hd\app.json

WAR 1.x

CATALINA_HOME\webapps\CAST-Health\portal\resources\cmp.json
CATALINA_HOME\webapps\CAST-Health\portal\resources\app.json
Note that if you want to add the tiles to the ISO-5055 view in the CAST Health Dashboard, you should modify the following files:
Embedded

%PROGRAMDATA%\CAST\Dashboards\<folder>\config\hd\cmp-ISO.json
%PROGRAMDATA%\CAST\Dashboards\<folder>\config\hd\app-ISO.json

JAR ≥ 2.x

%PROGRAMDATA%\CAST\Dashboards\HD\config\hd\cmp-ISO.json
%PROGRAMDATA%\CAST\Dashboards\HD\config\hd\app-ISO.json
WAR ≥ 2.x

CATALINA_HOME\webapps\CAST-Health\WEB-INF\classes\config\hd\cmp-ISO.json
CATALINA_HOME\webapps\CAST-Health\WEB-INF\classes\config\hd\app-ISO.json

WAR 1.x

CATALINA_HOME\webapps\CAST-Health\portal\resources\cmp-ISO.json
CATALINA_HOME\webapps\CAST-Health\portal\resources\app-ISO.json
cmp.json
Add the following plugin configuration to the file, then save the file:
{
    "id": 1041,
    "plugin": "IndustryStandards",
    "color": "eco-green",
    "parameters": {
        "type": "Green",
        "title": "Green",
        "widget": "gauge",
        "industryStandard": {
            "id": "20140522",
            "indexID": "20140522",
            "mode": "grade",
            "format": "0.00",
            "description": "grade"
        }
    }
}
CAST recommends adding the plugin to the Overview section of the file:
"areas": [
    {
        "id": 1,
        "title": "Overview",
        "panels": [
app.json
Add the following plugin configuration to the file then save the file:
{
    "id": 1040,
    "plugin": "IndustryStandard",
    "color": "eco-green",
    "parameters": {
        "type": "Green",
        "title": "Green",
        "widget": "gauge",
        "industryStandard": {
            "id": "20140522",
            "indexID": "20140522",
            "mode": "grade",
            "format": "0.00",
            "description": "grade"
        }
    }
}
CAST recommends adding the plugin to the Overview section of the file:
"areas": [
    {
        "id": 1,
        "title": "Overview",
        "panels": [
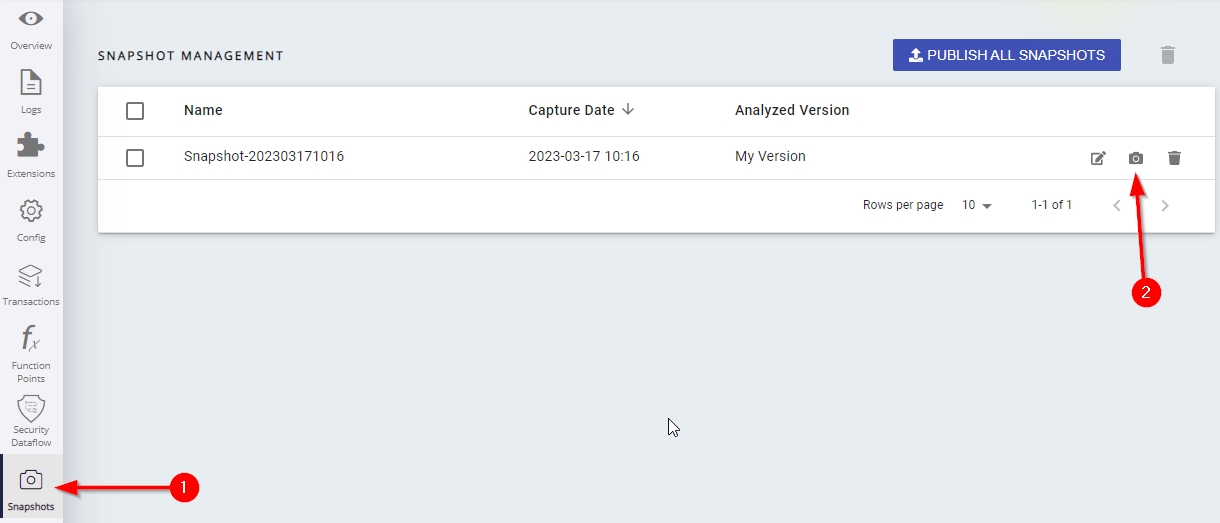
Step 2 - Consolidate your existing snapshot
Note that if you do not have an existing snapshot, please generate a new one (there is no need to consolidate this).
What results can you expect?
Once the analysis/snapshot generation has completed, you can view the results in the dashboards:
Engineering Dashboard
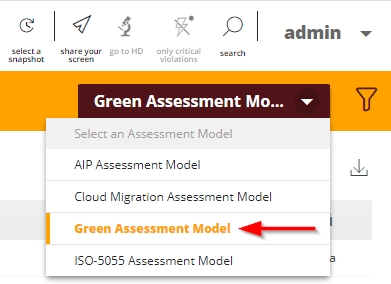
Out of the box, a specific Green Assessment Model entry is available:
Health Dashboard
The manually added Green tile will be available at both single and multi-Application level:

When using ≥ 2.11.2 clicking the tile will take you direct to the Green Health Factor displayed in a dedicated Green Assessment Model:
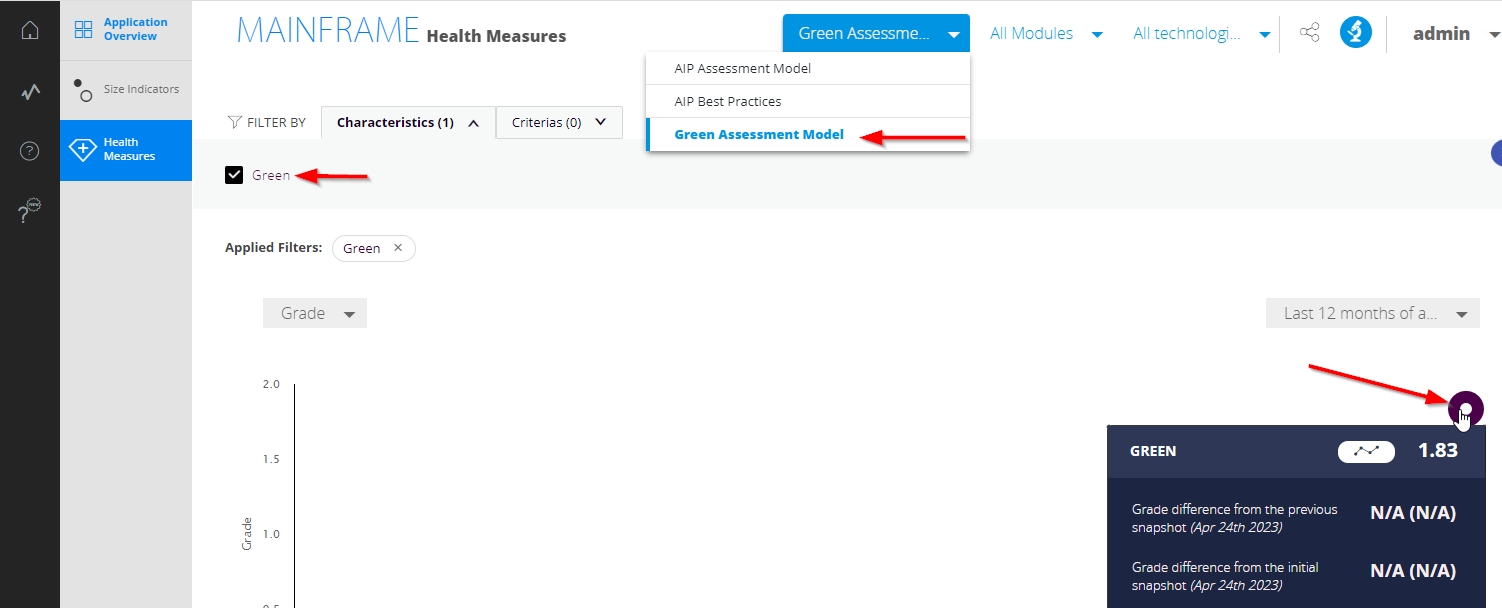
When using ≤ 2.11.1 clicking the tile will take you direct to the Green Health Factor displayed as part of the CAST Imaging Core Assessment Model:
To change the behaviour of the drill down from the Green tile, modify
the app.json file (location as described above) and locate the
following section:
"IndustryStandardsKeys": {
    "AIP": ["60017", "60012", "60014", "60013", "60016", "60011"],
    "Best-Practices": ["66032", "66031", "66033"],
    "CISQ": ["1062100", "1062101", "1062102", "1062103", "1062104"],
    "ISO-5055": ["1061000", "1061001", "1061002", "1061003", "1061004"]
},
If you are using ≥ 2.11.2 you can change the behaviour to match older releases of the Health Dashboard (placing the Green Health Factor within the default Assessment Model) by adding the ID “20140522” to the second line to give you:
"IndustryStandardsKeys": {
    "AIP": ["60017", "60012", "60014", "60013", "60016", "60011","20140522"],
    "Best-Practices": ["66032", "66031", "66033"],
    "CISQ": ["1062100", "1062101", "1062102", "1062103", "1062104"],
    "ISO-5055": ["1061000", "1061001", "1061002", "1061003", "1061004"]
},
If you are using ≤ 2.11.1 you can change the behaviour to match newer releases of the Health Dashboard (placing the Green Health Factor within a dedicated Green Assessment Model) by removing the ID “20140522” to the second line to give you:
"IndustryStandardsKeys": {
    "AIP": ["60017", "60012", "60014", "60013", "60016", "60011"],
    "Best-Practices": ["66032", "66031", "66033"],
    "CISQ": ["1062100", "1062101", "1062102", "1062103", "1062104"],
    "ISO-5055": ["1061000", "1061001", "1061002", "1061003", "1061004"]
},
In all cases, save the file and then restart the Dashboard service to ensure the behaviour is applied.
Technical note - removing the Green extension
Removing an extension is simple using CAST Imaging Console - use the delete button in the Application - Extensions panel:
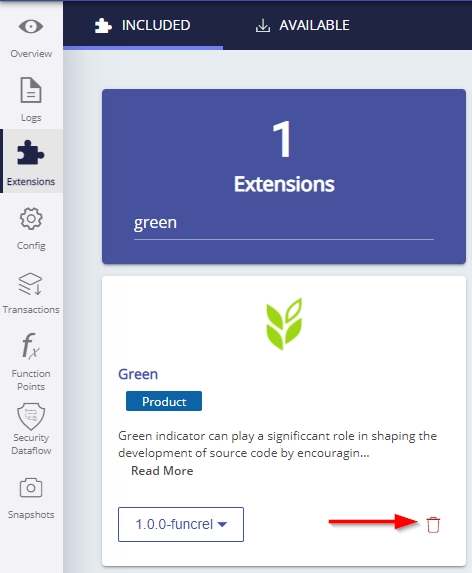
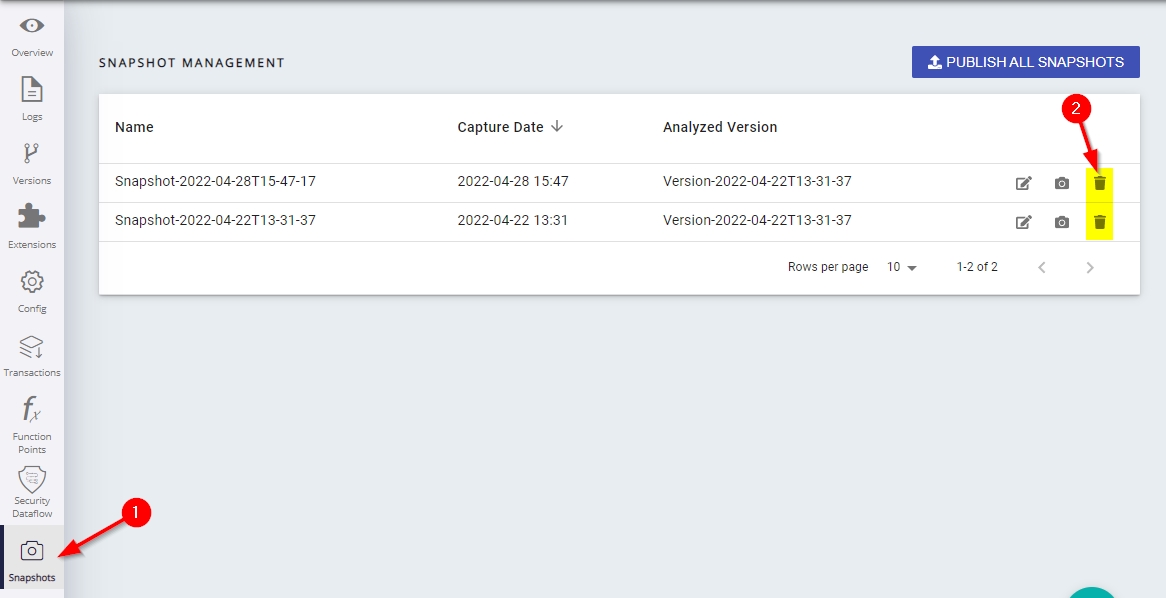
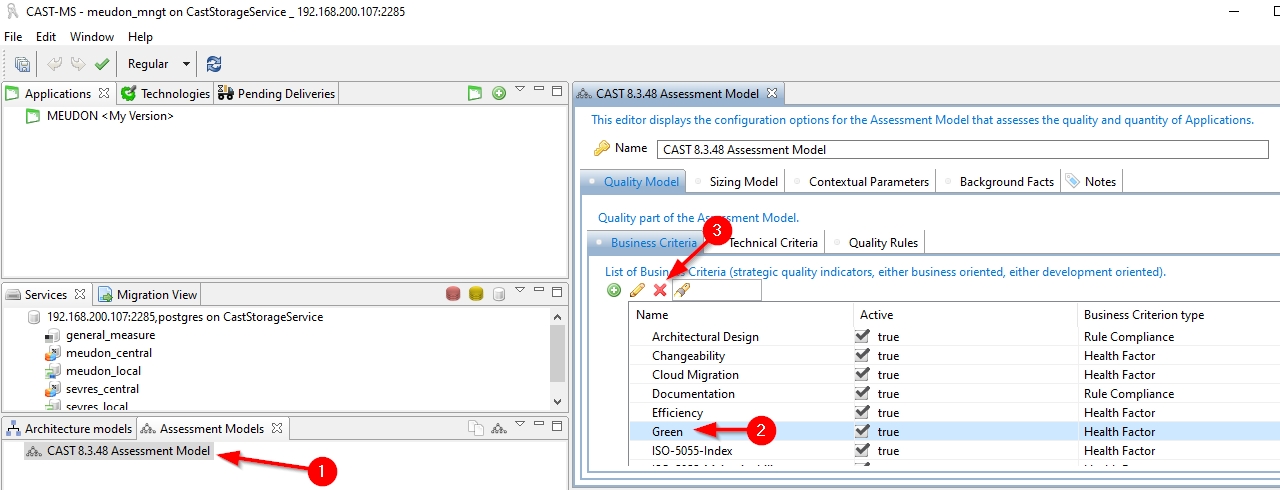
However, removing the extension does not remove the quality indicator that generates the results for this extension. This indicator is retained so that previous snapshots (where the Green quality indicator was used) are kept consistent - in other words generating a new snapshot will include the Green quality indicator. If you do not want to see any results for the Green indicator in your current, future or previous snapshots of your application, you need to:
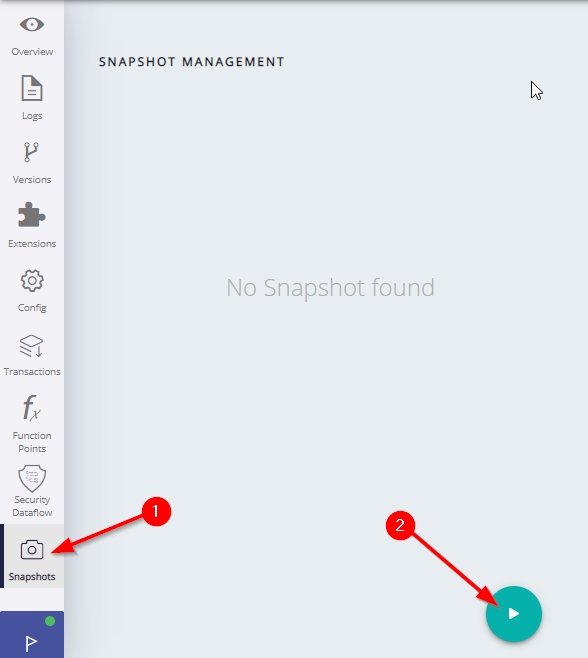
Remove the extension as described above and remove all previous snapshots using CAST Imaging Console:
Remove the quality indicator using legacy CAST Management Studio:
Generate a new snapshot using CAST Imaging Console:
Onboarding with Fast Scan
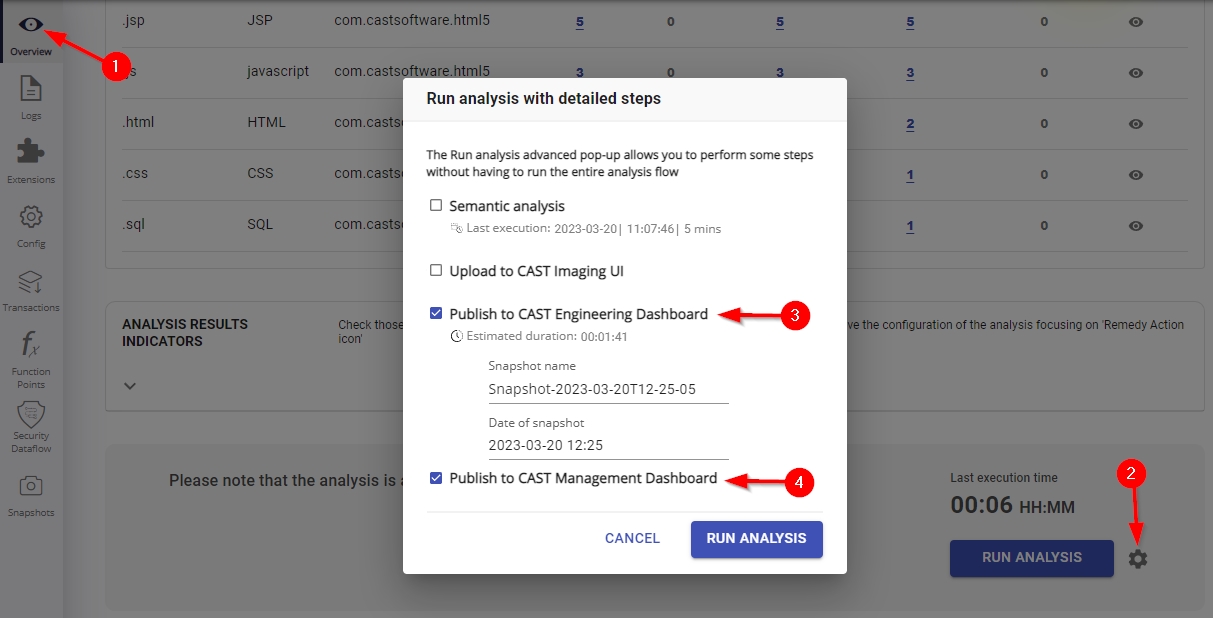
Legacy onboarding
Note that removing the extension does not remove the indicator tile from the CAST Health Dashboard if you have added it - this must be removed manually.