Explain View (Graph-Level AI Assistant)
Overview
The Explain View feature in CAST Imaging Express helps users understand complex architectural graph views by transforming them into clear, business-friendly explanations. It is designed to support architects, developers, managers, and stakeholders who need rapid insight into application structure without deep technical analysis.
How to access
-
Open any graph view in CAST Imaging Express.
-
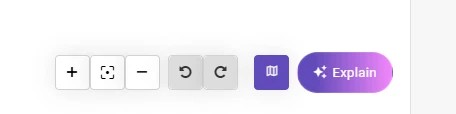
Click the Explain button at the bottom-right of the view.
-
Read the popup — it confirms that only data from the currently visible graph is sent to the AI. You can dismiss it permanently using Don’t show if desired.
-
Interact with the chatbot window that opens at the bottom-right. It presents an initial explanation and a prompt box for follow-up questions.
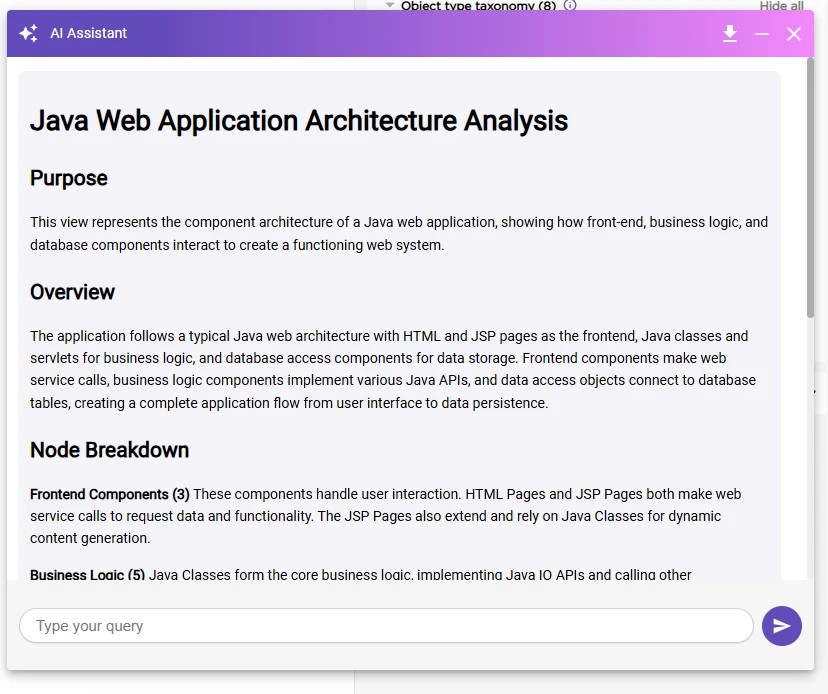
Use the download button in the chatbot header to review the exact data sent to the AI for the current view.
Purpose & capabilities
Explain View provides:
- Business-friendly summaries — High-level explanations of what the current view represents and why it matters.
- Relationship explanations — Descriptions of how components, layers, and nodes connect and interact.
- Interactive Q&A — Follow-up questions scoped strictly to the currently visible view.
This feature is intended to accelerate understanding, support communication, and improve knowledge transfer.
Typical AI response structure
Each AI-generated explanation includes:
| Section | Description |
|---|---|
| Purpose | A brief statement describing what the view represents. |
| Overview | A high-level explanation of how major components relate. |
| Component Breakdown | The roles of key node types and their relationships. |
| Top Insights | A short list of prioritized takeaways for stakeholders. |
What data is used
Transmitted to the AI
- Graph metadata (node names, types, and relationships)
- Layout coordinates (to support spatial and contextual descriptions)
- Only the currently visible subset of the graph view
Never transmitted
- Source code content
- Proprietary business logic or detailed implementations
- Credentials, secrets, or sensitive configuration values
No source code is ever sent to the AI. Only structural metadata from the visible graph view is processed.
Processing flow
User View → Graph Metadata Extraction → Claude Sonnet → Business-Friendly Explanation
Best practices
- Zoom or filter the view to the most relevant scope before clicking Explain to get targeted results.
- Use follow-up questions to clarify specific relationships or components.
- Download and review the transmitted payload when validating data boundaries with stakeholders.
Limitations
- Context is limited to the visible view; switching views resets the context.
- Explanations reflect metadata only — they do not infer hidden business rules from source code.
- AI does not validate architectural correctness.
Recommended usage scenarios
| Scenario | How the AI Helps |
|---|---|
| Executive briefings | Concise, non-technical summaries for stakeholders. |
| Architecture reviews | Accelerates comprehension of relationships and dependencies. |
| Knowledge transfer | Self-service exploration and consistent explanations across views. |
| Pre-migration analysis | Business-level application overview. |
User responsibility & consent
By using Explain View, you acknowledge that structured graph metadata may be transmitted to an AI service. You are responsible for ensuring that the visible graph scope is appropriate for AI-assisted analysis.
These features are governed by CAST’s Artificial Intelligence and Machine Learning Terms.