CAST Extend Settings
Overview
The CAST Extend Settings control the integration with CAST Extend . CAST Extend is CAST’s own repository of extensions for use during analyses and access to this for managing your extension is provided in the UI. When a fresh installation of CAST Imaging is initialized, CAST Extend settings are referenced: these settings are displayed in this panel.
You can therefore use the panel to update the settings for CAST Extend, i.e. if you want to change the user name, or if you want to start using Extend local Server.
Settings
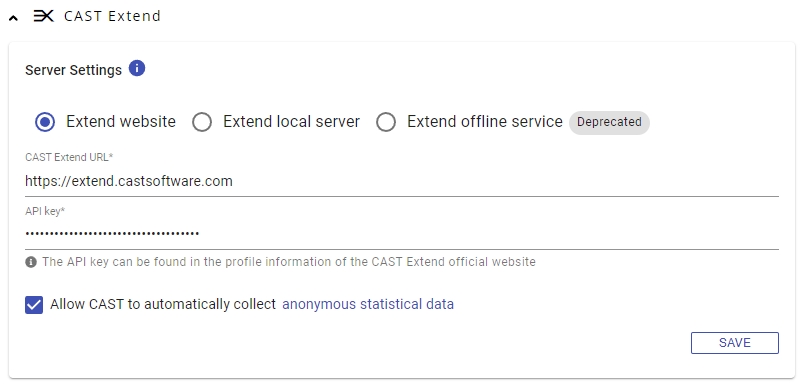
Extend website
This mode configures each node to connect to [https://extend.castsoftware.com](CAST’s publicly available extension server) over the internet on port 443 via TCP. The CAST Extend URL field will be automatically populated with the https://extend.castsoftware.com in read-only mode (i.e. the URL cannot be changed). Your CAST Extend API key as input during the installation process (this can be generated in the CAST Extend UI) will also be displayed.
If you do not have a CAST Extend account, you can register, for free, using the following URL: https://extend.castsoftware.com/#/register .
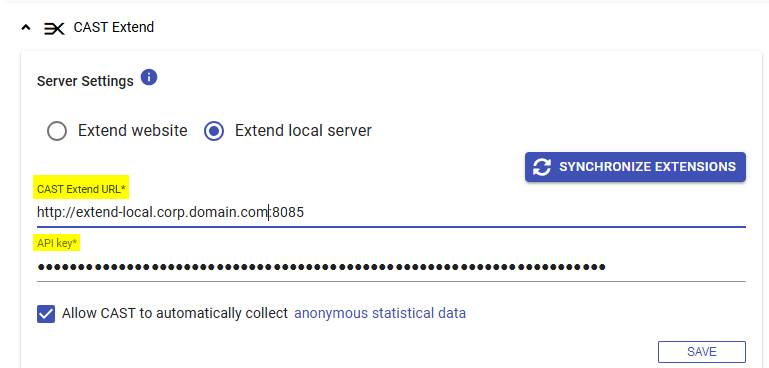
Extend Local Server
This mode configures each node to connect to an on-premises deployment of Extend Local Server, therefore avoiding a connection to CAST’s publicly available extension server over the internet (in other words this option is aimed at those who cannot access internet resources from the CAST Imaging installation):
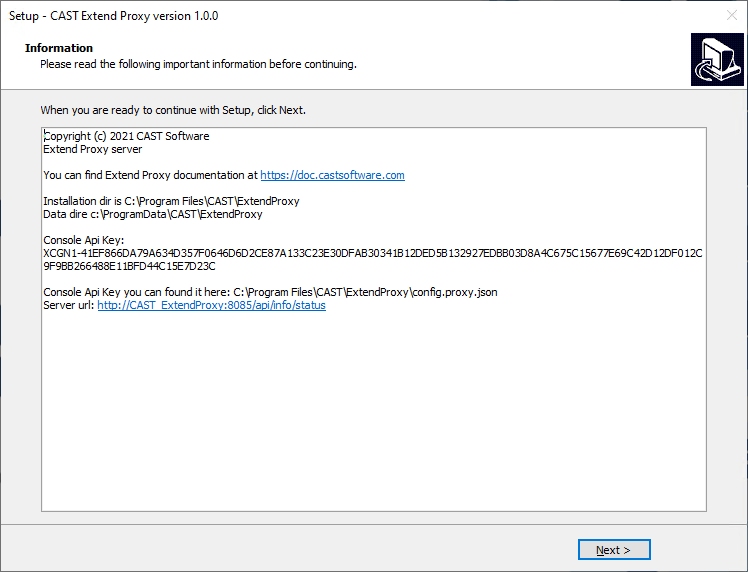
API key
The API Key will have been generated during the installation of Extend Local Server and is displayed in the final summary screen of the installer on Microsoft Windows:
Or by running docker logs cast_extend_proxy on Linux via Docker:
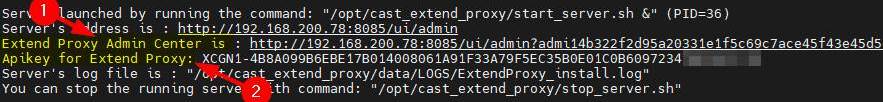
Alternatively you can find the API key (on the line APIKEY) in the following locations on the machine on which Extend Local Server is installed:
Microsoft Windows: %PROGRAMDATA%\CAST\Extend\config.proxy.json
Linux via Docker: /shared/extend_data/config.proxy.json
Synchronize Extensions
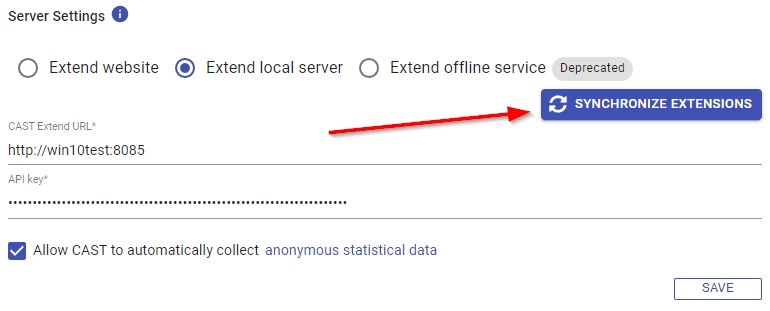
This button is displayed when the connection settings are input and saved. This option will force Extend Local Server (when running in online mode) to fetch the extension “manifest” - i.e. information that CAST Imaging requires in order to request the correct extension:
- available extensions
- available releases
- technology to extension mappings
This process is also automated (every two hours).
Allow CAST to automatically collect anonymous statistical data
In order to provide an estimate of the time required to fully analyze a given application version, CAST needs to collect anonymous data relating to the volume of files to be analyzed, the performance/specification of the analysis server and the actual time taken to perform analyses and generate snapshots. The data collected will be stored by CAST on its CAST Extend server and will not contain any information that would allow the identification of any customer related information or application. The data stored by CAST is purely statistical and is related only to the size and duration of analyses and snapshot generation (an example of the data collected by CAST is available for download in .json format here) - see below for information about the fields in the .json file. The richer the database of information we hold, the more accurate the estimation will be.
By default, this option is enabled in the initial start-up wizard - in other words you are automatically opted-in and can disable the option at any time in this panel.
.json statistical data fields
| Field(s) | What is collected | Scope / exclusions |
|---|---|---|
appGuid versionGuid |
Internal UUIDs identifying the application and version | No user-facing names or paths |
nbApplication nbModules nbRunningJobs |
Count of applications, modules, and concurrent jobs | Counts only |
loc aep afp |
Lines of code, AEP count, AFP count from snapshot overview | Aggregate numbers |
securityDataflowChecked architectureChecked |
Boolean flags indicating whether security dataflow and architecture model features were used | true / false only |
scanDateTime |
Timestamp of the profiler scan | ISO datetime |
analysisDuration snapshotDuration installExtensionDuration updateExtensionDuration prepareAnalysisConfigDuration prepareAnalysisDataDuration publishToManagementDuration publishToImagingDuration |
Duration in seconds for each job step | Numeric seconds, no log content |
fileExtensions analyzedFiles |
Map of file extension to occurrence count (e.g. {java: 120, xml: 40}) |
Extensions only — no file names or paths |
castTechnologies discoveredTechnologies |
Set of CAST technology names detected in the project | Vendor-defined names only |
extensions |
Set of installed CAST extension IDs and their versions | Extension registry IDs only |
objectives |
Set of version objective labels | Enum strings |
totalMemory logicalCpuCount physicalCpuCount cpuFrequency storageCapacity storageAvailable |
Hardware specs of the analysis node | Generic hardware metrics |
executionPlatform.OS executionPlatform.caipVersion executionPlatform.profilerVersion executionPlatform.freeMemory executionPlatform.diskSpace executionPlatform.mediaType |
OS name + architecture, CAIP and profiler version strings, memory/disk usage during analysis | No hostnames or IPs |
executionPlatform.databaseLocation |
Whether the analysis database is co-located with the node | Value is "local", "remote", or "unknown" — no hostname, no credentials |
analysisStatus snapshotStatus |
Step outcome ("success" / "fail") and error message strings from the main log when a step fails |
Log messages may contain internal paths on failure |
detectedFrameworks |
Framework names detected by the profiler (lowercased) | Reveals tech stack composition |
java imports java annotations imported java classes |
Java import statements, annotation names, and class names referenced in the codebase | May expose internal package naming conventions |
c# usings c# annotations used cs classes |
C# using directives, annotation names, and referenced class names | May expose internal namespace structure |
maven |
Maven dependency identifiers from the project | Reveals third-party library choices |
javascript requires typescript requires package.json |
JS/TS require() calls and package.json dependency entries |
Reveals npm dependency inventory |
patterns |
Pattern keys detected by the profiler | Profiler-defined identifiers |
graphviz |
Graphviz availability status from profiler result | Tool detection flag |
- ✅ No personally identifiable information (PII) is collected at any point.
- ✅ No database passwords, connection strings, or hostnames are transmitted. The database field records only
"local"or"remote". - ✅ No source code content is collected. File analysis produces extension counts only — no file names or paths.
- ⚠️ Technology stack metadata (import names, framework names, package identifiers) is collected to improve analysis accuracy. This reveals the libraries and frameworks in use but not proprietary code.