Quick Start - Windows
Overview
This guide covers the installation and initial configuration of all CAST Imaging components on a single Microsoft Windows machine, using default settings throughout. It is intended for POCs, demos and evaluation. For production deployments, distributed mode, or advanced configuration options see Installation on Microsoft Windows.
Quickstart installation instructions for Linux via Docker can be found in Quick Start - Docker.
Requirements
- Hardware requirements
- Software requirements
- Disk space requirements
- Internet access to download the installer
Step 1 - Install PostgreSQL
PostgreSQL is the database used by CAST Imaging to store configuration and analysis results. See Install PostgreSQL for Microsoft Windows for full details.
- Download the PostgreSQL installer (64-bit) from the PostgreSQL downloads page (EnterpriseDB) .
- Run the installer with elevated permissions (right-click,
Run as administrator) and follow the interactive wizard. Set the port to 2284 when prompted. Set the locale to C when prompted.
Leave all other settings at their default position.
After successful installation you will find a functioning PostgreSQL instance on localhost:2284. See Post database installation action items to create the default operator/CastAIP credentials.
Step 2 - Install CAST Imaging Core
CAST Imaging Core 8.4 is the analysis engine providing core services to the CAST analyzers.
- Download and unzip the latest release of com.castsoftware.imaging.core on your local disk.
- Execute the
setup.batfile with elevated permissions (right-click,Run as administrator) at the root of the unzipped files.
Leave all settings at their default position.
Step 3 - Install CAST Imaging
CAST Imaging is the web application used to launch analyses of your application and view results. The CAST Imaging analysis-node service provides communication between CAST Imaging and the CAST Imaging Core.
- Download and unzip the latest release of com.castsoftware.imaging.console on your local disk.
- Locate the
config-all.conffile at the root of the unzipped files and open it with a text editor. - Check that all parameters match your installation requirements. A full explanation of each parameter is provided in Installation variables, but leaving the settings at their default will provide a working installation.
- Open a CMD window with elevated permissions (right-click,
Run as administrator) and execute the following command from the root of the unzipped files:
cast-imaging-install.bat package=all
Two schemas called control_panel and keycloak will be created in the database of your choice (postgres by default) on the target PostgreSQL instance - if either of these schemas already exist they will be re-used and this may cause unexpected behaviour.
Step 4 - Complete initial configuration
Browse to http://localhost:8090 to access CAST Imaging (or use your machine’s fully qualified domain name or IP address).
- Log in using the default
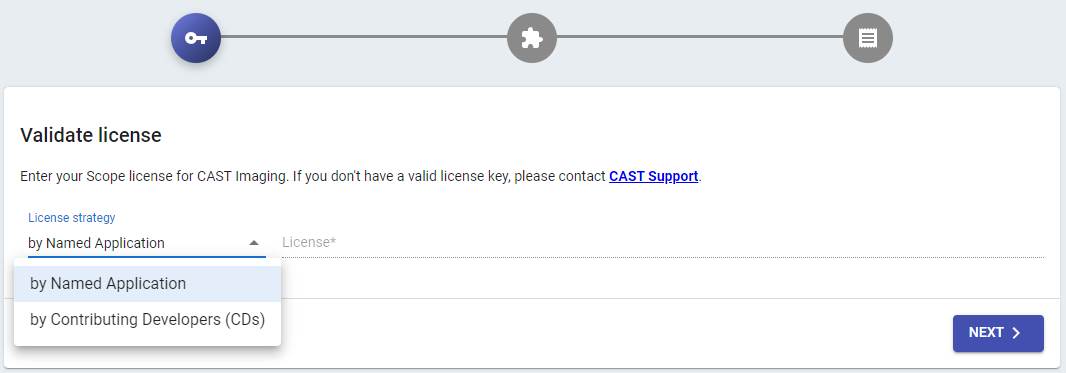
admin/admincredentials. You will be prompted to configure various options - Enter your licensing strategy. Choose either a
Named Applicationstrategy (where each application you onboard requires a dedicated license key entered when you perform the onboarding), or aContributing Developersstrategy (a global license key based on the number of users):
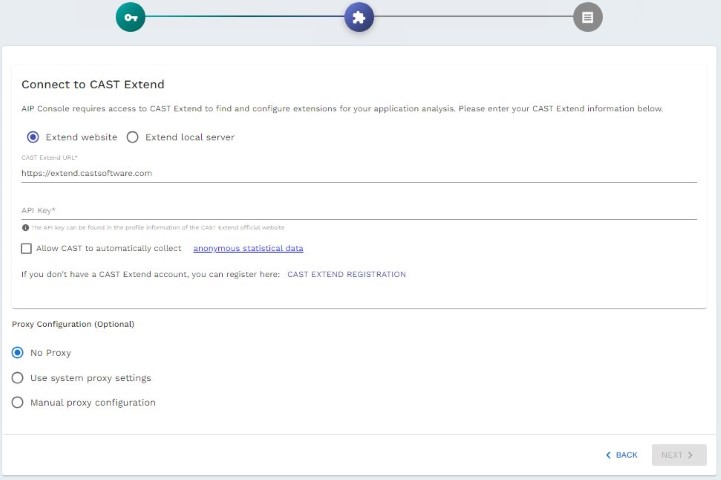
- Configure your CAST Extend settings / Proxy settings:
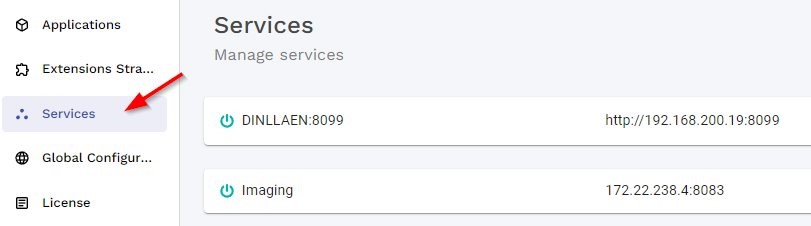
- Browse to the URL below and ensure that you have one
analysis-nodeand theimaging-viewercomponents listed:
http://localhost:8090/admin/services
Step 5 - Onboard a simple application
Prepare your source code
Prepare a ZIP file containing the source code to onboard and analyze:
- Create a temporary folder
- Add your client code in one sub-folder
- Add your database code in another sub-folder
- Zip the two sub-folders into one single ZIP file
For example:
|---folder
    |---JEE
    |---SQL
Onboard your new application
Follow these steps to onboard your application:
- Browse to
http://localhost:8090/console - Click Add an application > Onboard an application
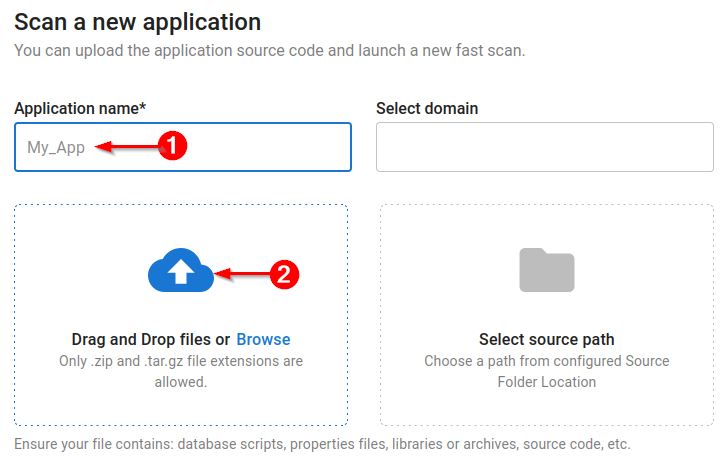
- Enter a name for your application (1)
- Click the upload button (2) to attach the ZIP file you created previously:
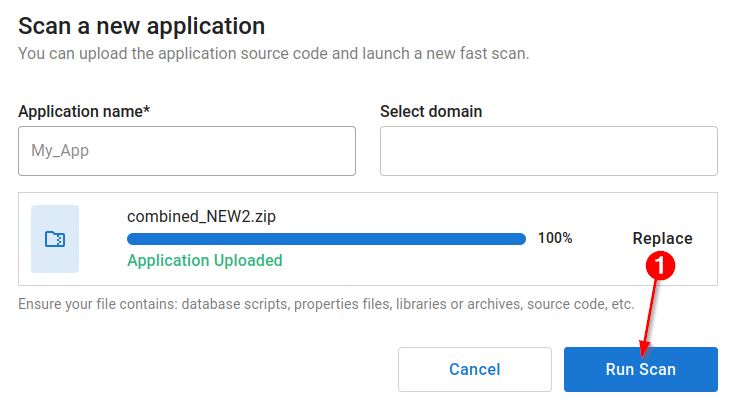
- Click Run Scan (1) to begin the initial “fast scan” of your source code: this allows CAST to discover what is in the ZIP file and how to handle it during the analysis process:
Start your analysis
When the ZIP file is scanned, results are automatically displayed.
- Scroll to the bottom of the page
- Check the panel at the bottom: if you have a green tick (1), you are good to go and you can start the analysis process (2):

If you do not have a green tick, you need to re-organize the source code in your ZIP file.
Consult your results
When the analysis is complete, browse to http://localhost:8090/console, and click Ready to view for your application:

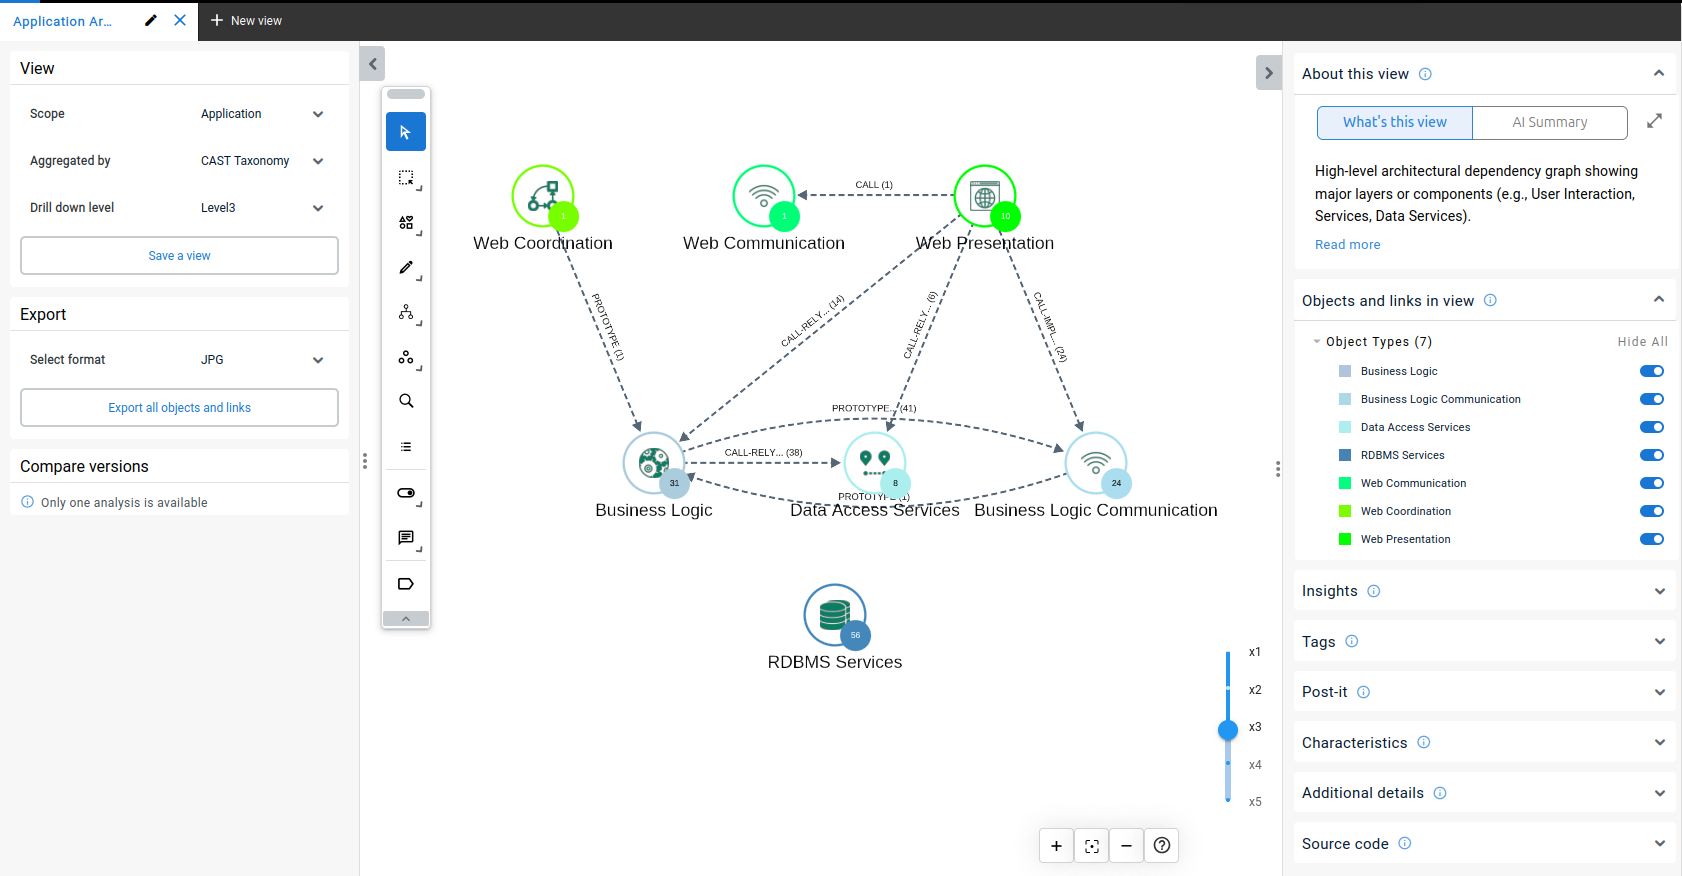
The results of your application analysis will be displayed: use the left-hand panel, or double-click items in the “view” to navigate your application and the objects within it:
Next steps
- Log in and navigate the welcome page - understand the welcome page tiles and application selection
- Understand the user interface - a tour of the four main UI areas
- Full installation guide - all platforms, production configuration, HTTPS, authentication