- Introduction
- Requirements
- Pre-installation check list
- Installation procedure
- Step 1 - Unpack the ZIP file
- Step 2 - Configure the connection parameters
- Step 3 - Install the Microsoft Windows Service to start/stop the application server - optional
- Step 4 - Start the dashboard and test connection
- Step 5 - Configure user authentication
- Step 6 - First login and become admin - ≥ 2.1 only
- Step 7 - Configure roles
- Step 8 - Upload snapshot data for display in Health Dashboard
- Step 9 - Configure data authorization
- Step 10 - Configure access to the Engineering Dashboard and from the Health Dashboard
- Additional information
Introduction
What is the ZIP file format?
From release 2.0 onwards, CAST will deliver a ZIP file for each CAST Dashboard, alongside the traditional WAR file that has always been delivered. The ZIP file is a new method of deploying the CAST Dashboards based on Spring Boot and does not require a web application server (the application server is embedded in the ZIP itself). The aim of the ZIP file releases is to simplify and speed up the deployment of the CAST Dashboards. The deployment and configuration of the Spring Boot based dashboards differs slightly to the steps required for traditional WAR files (see Standalone Health Dashboard deployment using WAR file).
How many Health Dashboards do I need?
CAST highly recommends that you install one Health Dashboard to display snapshot data from all your Applications whether they are stored in one or multiple Dashboard schemas. When configuring the Health Dashboard, you should therefore:
- Configure a connection to one single Measurement schema
- Consolidate data from all your Dashboard schemas in this single Measurement schema
Note that:
- the Health Dashboard can officially support the upload of a maximum of 200 applications. CAST recommends that you choose only the most critical applications from the business view point - i.e the applications that need to be monitored with high visibility by CIOs and managers. If you need to upload more than 200 applications, please see Configure the Health Dashboard for large numbers of Applications (this information is equally valid for uploading below 200 Applications).
- "authorizations" can help separate Application data if you have users that are only authorised to access data from specific Applications - Data authorization.
Standalone or combined ZIP file?
CAST provides the Health Dashboard in a ZIP as follows:
| ZIP file name | Description |
|---|---|
| com.castsoftware.aip.dashboard.health.<version>.zip | Traditional "standalone" ZIP file containing only the Health Dashboard. This document describes the installation using this ZIP file. |
| com.castsoftware.aip.dashboard.<version>.zip | "Combined" ZIP file containing both the Health Dashboard and the Engineering Dashboard. |
You are free to use whichever ZIP file you prefer to deploy the Health Dashboard (the requirements and prerequisites are identical for both ZIP files), however if you are using both the CAST Health and Engineering Dashboard, to fulfil (for example) a "risk and quality" use case, then it would make sense to take advantage of the combined com.castsoftware.aip.dashboard.<version>.ZIP file and deploy both dashboards from the same ZIP file. If you do so, please note the following about using the "combined" ZIP file:
- There is no need to specifically configure a URL for your Engineering Dashboard drilldown (via the "microscope" icon) - when using the combined "ZIP" file, access to the Engineering Dashboard from the Health Dashboard is pre-configured.
- Security access and authentication is common to both Dashboards. Therefore, if you setup Active Directory authentication, then this must be used to access both Dashboards - you cannot use "Default Authentication" for one Dashboard and "Active Directory" for the other.
- Role configuration is common to both Dashboards. Therefore "UserA" that has been granted the "admin" role, will have the "admin" role in both Dashboards.
- Data authorization is common to both Dashboards. Therefore if you authorize "UserA" to view Application "B" only via the authorizations.xml file, then this is true for both Dashboards. Note that authorizations based only on Tags and Categories created for the Health Dashboard (Tags and Categories are a feature that is not available in the Engineering Dashboard) WILL be applied in the Engineering Dashboard when using the combined ZIP file.
- Group configuration is common to both Dashboards, regardless of the authentication mode in use. Therefore if you authorize "GroupD" to view Application "E" only, then this is true for both Dashboards.
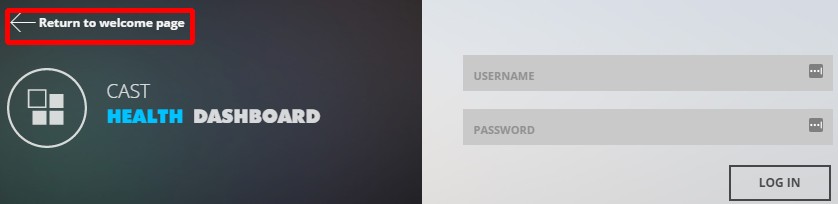
- On login, the user will be presented with a choice of Dashboard as shown below (Image 1) in a "Welcome" page. Clicking Access will take the user to the custom login screen for the chosen Dashboard where a "Return to welcome page" URL is available if the user wishes to login to the other Dashboard (Image 2):
Image 1 - Welcome page
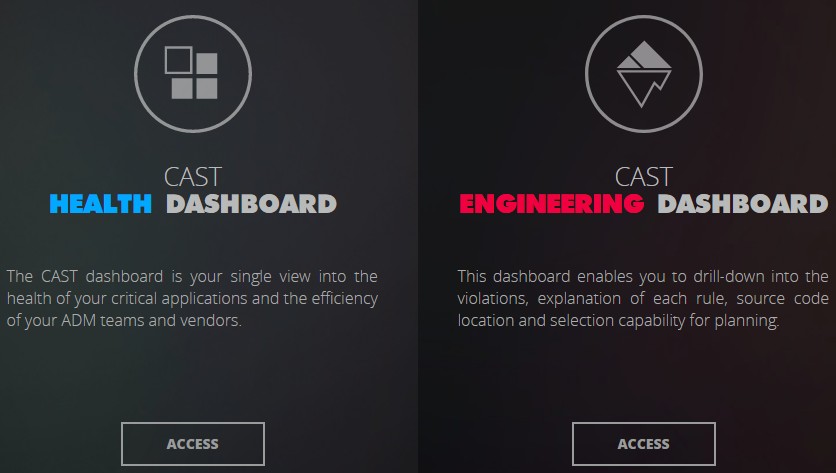
Image 2 - Return to welcome page URL
Requirements
See Standalone dashboard - installation requirements.
Pre-installation check list
Before beginning the installation process, please ensure that you have carried out all of the following tasks and that the following requirements have been met:
| Ensure you have read all Release Notes accompanying CAST products for any last-minute information. |
| Decide where the Health Dashboard will be installed. |
| Ensure that your user login on the target machine has sufficient user privileges to install applications. |
| Make sure you have the required .ZIP file ready for deployment |
Installation procedure
The installation process is divided into various steps:
| Step 1 | Rename and deploy the .ZIP file on your application server |
|---|---|
| Step 2 | Configure your deployed .ZIP file |
| Step 3 | Install the Microsoft Windows Service to start/stop the application server - optional |
| Step 4 | Start the dashboard and test connection |
| Step 5 | Configure user authentication |
| Step 6 | First login and become admin - ≥ 2.1 only |
| Step 7 | Configure roles |
| Step 8 | Upload snapshot data for display in Health Dashboard |
| Step 9 | Configure data authorization |
| Step 10 | Configure access to the Engineering Dashboard and from the Health Dashboard |
Step 1 - Unpack the ZIP file
Unpack the ZIP file on the server. You can run the dashboard directly from wherever you unpack the ZIP file, however, you may want to move the unpacked files to a more appropriate location.
Step 2 - Configure the connection parameters
Modify application.properties to define connection to CSS/PostgreSQL for AIP schemas
Modify domains.properties
Modify application.properties to define connection to CSS/PostgreSQL for the roles/permissions schema - ≥ 2.1 only
Step 3 - Install the Microsoft Windows Service to start/stop the application server - optional
If you have deployed the ZIP file on Microsoft Windows and would like to control the application server via a Microsoft Windows Service, CAST provides an installation batch script to do this for you. Locate the following file:
<unpacked_zip>\dashboard-service-install.bat
Double click this file to start the service installation. You may be prompted to accept a UAC warning:
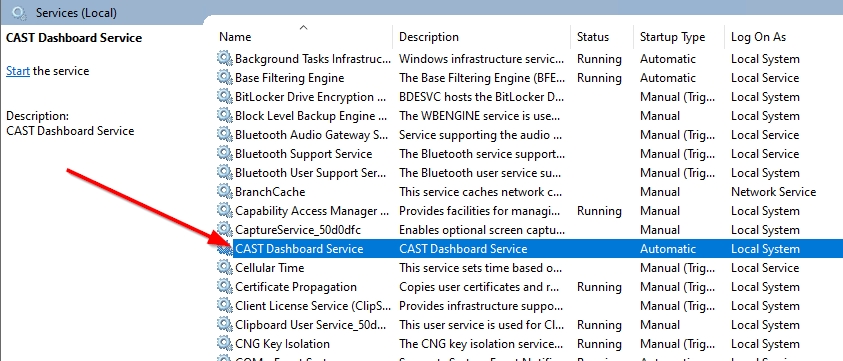
On completion the service will be listed as CAST Dashboard Service with a startup type set to Automatic, log on as Local System and will not be running:
- The installer requires:
- Java JDK/JRE ≥ 8
- a JAVA_HOME system environment variable pointing to the installation location of the Java JDK
- The .bat installer will configure the service to use the <unpacked_zip>\amd64\dashboard-service.exe. You may want to ensure that the unpacked zip file is in an appropriate location.
- You can change the log on as, after the install has completed by right clicking the service and changing the options in the Log On tab:

- The installer will set the service to use the following RAM memory - you may find that this is not sufficient. See Apache Tomcat performance considerations for information about memory requirements.
- Initial memory pool = 256MB
- Maximum memory pool = 1024MB

Step 4 - Start the dashboard and test connection
To start the dashboard:
- either start the Windows Service if you are using Microsoft Windows and have chosen to install the Windows Service
- or run the following file:
Microsoft Windows
<unpacked_zip>\startup.bat

Linux
<unpacked_zip>\startup.sh
Note that you may need to run "chmod +x startup.sh" to grant execution permission to the script before running it.
You may also need to run this file with elevated permissions (e.g. sudo) using the following syntax "./startup.sh"
By default the dashboard is configured to run on port 8080. Use the following URL - where <server_name> is equal to the host name of the current server to access the dashboard. If you are testing on the server itself, you can use http://localhost:8080:
http://<server_name>:8080
You should see the login page as follows - this indicates that the initial setup was successful:
- Error messages are documented in Error Messages.
- See Modify the user access port for 2.x JAR or ZIP deployments for more information about changing the default port 8080.
Step 5 - Configure user authentication
This step involves configuring how your users will authenticate with the CAST Health Dashboard. Most organizations opt for LDAP/Active Directory integration so that users can use their corporate username/password to access the resources they need. The Health Dashboard also has a built in username/password authentication mechanism which is enabled "out of the box". See User authentication.
Step 6 - First login and become admin - ≥ 2.1 only
By default, the CAST Dashboard requires that at least one user is granted the ADMIN role following the first login after the User authentication configuration. This ensures that one user can access all data and cofiguration settings. See First login and become admin. This step is not required when using Dashboards 1.x and can be skipped.
Step 7 - Configure roles
This step involves configuring roles for users and groups that are accessing the CAST Health Dashboard. See User roles.
Step 8 - Upload snapshot data for display in Health Dashboard
Before your users can view any data in the Health Dashboard, you need to upload your snapshot data to the Measurement schema once it has been generated. The snapshot upload is achieved using AIP Console.
- The Health Dashboard can officially support the upload of a maximum of 200 applications. CAST recommends that you choose only the most critical applications from the business view point - i.e the applications that need to be monitored with high visibility by CIOs and managers.
- The Health Dashboard features a server cache to improve the speed of data display. This does mean, however, that very recent changes in data (i.e. a new snapshot generation) may not instantly appear in the dashboard. If this is the case, the server cache needs to be manually reloaded. See Reload the cache.
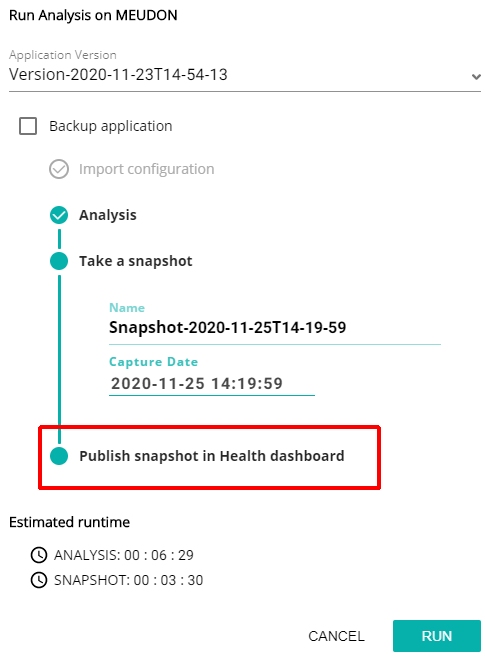
When using AIP Console, the Measurement schema is automatically activated for all your Application analyses on all AIP Nodes (only one Measurement schema can be managed per AIP Console instance). When you run an analysis or snapshot, you can choose to upload the results immediately to the Measurement schema:
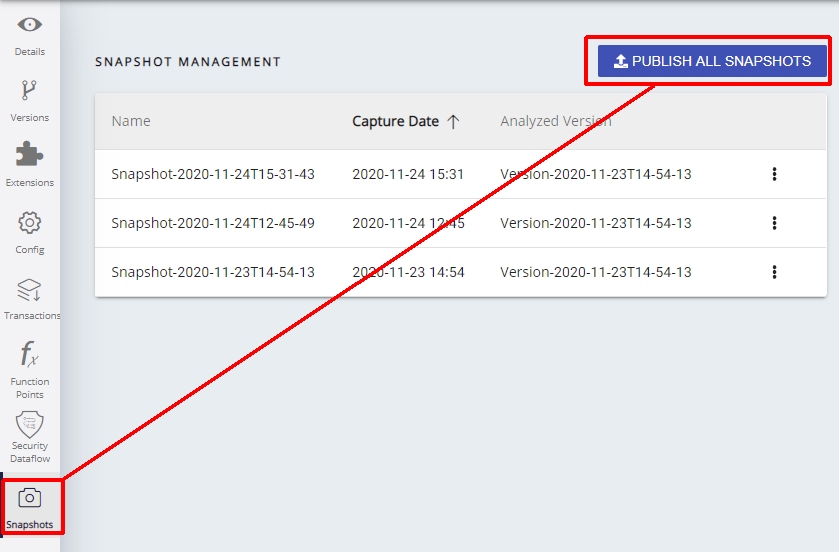
You can also manually upload snapshots using the Application - Snapshots interface:
Step 9 - Configure data authorization
An Authorization defines permission to access and "consume the data" in a specific Application or group of Applications via the CAST Health Dashboard. If permission is not granted, or a "restriction" is used, then any information related to this Application will be not accessible: application properties such as name, technologies or grades and measures, etc. Therefore, an Authorization must be defined before a user/group of users can access a specific application. See Data authorization.
Step 10 - Configure access to the Engineering Dashboard and from the Health Dashboard
The Health Dashboard enables users (via the "microscope" icon) to access directly the underlying data in the Dashboard schema via the Engineering Dashboard. The Engineering Dashboard provides detailed information about the top level data displayed in the Health Dashboard. This configuration is license dependent.
Access to the underlying data is provided via a URL (pointing to the required dashboard) that is stored in the Measurement schema.
Combined ZIP file
If you have deployed the Health Dashboard and Engineering Dashboard from the combined Health/Engineering .ZIP file, access to the Engineering Dashboard is implemented automatically. You do not need to do anything further.
- automatic access is only implemented for each Dashboard schema that is configured for viewing in the Engineering Dashboard. So if you have consolidated data from a Dashboard schema into a Measurement schema for viewing in the Health Dashboard, but you have not declared this Dashboard schema in the Engineering Dashboard configuration, then the automatic access will not function and users will be notified that access is not yet configured.
- automatic access cannot be overridden to point to a separate Engineering Dashboard deployment.
Standalone ZIP files
If you have deployed the Health Dashboard and Engineering Dashboard using the standalone Health / Engineering .ZIP files, then access to the Engineering Dashboard (ED) is not implemented automatically and you will need to proceed as follows:
Note that:
- you will need to repeat this action for EACH Dashboard schema (the CAST AIP schema used by the Engineering Dashboard) that you want your users to be able to drill down to.
- you may need a specific license that enables access to the Engineering Dashboard before this feature will function in the Health Dashboard.
- you must have already generated a snapshot and uploaded snapshot data to the Measurement schema before you attempt this
- the separate standalone ZIP files must all originate from the SAME release. Using ZIP files from different releases is not supported.
- For each Dashboard schema that you want to drill down into, you must first determine the context "name" of the Dashboard schema as defined in the context.xml file for the Engineering Dashboard.
- First locate and open the following file in an editor:
<unpacked_zip>\configurations\domains.properties
Locate the domain name (the first entry in each row) that corresponds to the Dashboard schema you need your users to drill down into and take note of it. In this example we want users to drill down to V80_CENTRAL_APP1 which corresponds to the domain APP1:
# Domains for ED
# empty lines in this file lead to connection error, remove all empty lines
# - You have to align [Resource1] with the resource name configured in application.properties
# - You have to replace [Central Schema1] by the central schema name
# - Domains names must be unique
# AED1=Resource1,[Central Schema1]
# AED2=Resource1,[Central Schema2]
APP1=Resource1,V80_CENTRAL_APP1
APP2=Resource1,SEVRES_CENTRAL
APP3=Resource2,PARIS_CENTRAL
Open the CAST Management Studio and move to the Services view. Double click the corresponding Dashboard Service to open its editor (i.e the V80_CENTRAL_APP1 in this example):
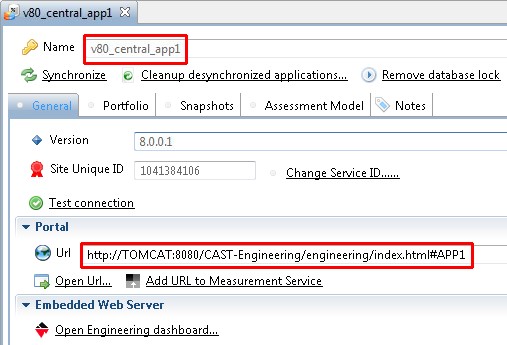
- Enter the URL to your Engineering Dashboard. This will take the following form http://<server>:<port>/engineering/index.html#<context-name> - you should tailor the <server> and <port> entries to your environment. The <context-name> value refers the value we determined earlier, in this example APP1. So we will add the following URL: http://TOMCAT:8080/engineering/index.html#APP1
- Click the Add URL to Measurement Service
- Restart your application server so that the changes are taken into account.
- Now users can drill down into the Engineering Dashboard.
Additional information
Advanced configuration specific to the CAST Health Dashboard:
Additional advanced configuration options: