Health Dashboard tile management
Summary: This page explains how to configure the Health Dashboard tile interface
Introduction
The Health Dashboard has a “tile” or “panel” based interface that provides access to the data:

These tiles have default presentation settings, but this can be modified and tailored to your requirements. For example:
- Tile colours can be changed
- Tile positions can be changed
- Tile contents can be changed
- Tile size can be changed
- New tiles can be added
Editing your tiles presentation
The default tile presentation is defined in the files listed below. To modify the presentation, edit the .json file with a text editor (Notepad or other similar application). CAST recommends:
- creating a copy of the default .json files that can be used as a replacement if an error occurs during editing
- first changing existing parameters such as color and title and also moving Tiles around before you begin making large scale and more complex changes
| File name | Usage |
|---|---|
WAR 1.x
WAR ≥ 2.x
ZIP ≥ 2.x
| This file governs the display of tiles when your Measurement Service contains multiple Applications - i.e the Multi-application landing page. For more information about the Multi-application and Application landing pages, see Health Dashboard - GUI. |
WAR 1.x
WAR ≥ 2.x
ZIP ≥ 2.x
| This file governs the display of tiles for a single Application - i.e the Application landing page. This page is displayed in two situations:
For more information about the Multi-application and Application landing pages, see Health Dashboard - GUI. |
Starting from ≥ 1.27 and**≥ 2.1**, two additional json files have been added that are used to display tiles for the ISO-5055 view that uses data generated by the ISO-5055 Index extension:
WAR 1.x
- CATALINA_HOME\webapps\CAST-Health\portal\resources*app-ISO.json*
- CATALINA_HOME\webapps\CAST-Health\portal\resources*cmp-ISO.json*
WAR ≥ 2.x
- CATALINA_HOME\webapps\CAST-Health\WEB-INF\classes\config\hd*app-ISO.json*
- CATALINA_HOME\webapps\CAST-Health\WEB-INF\classes\config\hd*cmp-ISO.json*
ZIP ≥ 2.x
- <unpacked_zip>\configurations\config\hd*app-ISO.json*
- <unpacked_zip>\configurations\config\hd*cmp-ISO.json*
See Manual configuration of Dashboard tiles using ISO-5055 data for more information.

Library files
CAST provides “library” files containing examples of all the tiles that can be created and used in the Health Dashboard. You can use these files as well as the examples in this documentation page to build your own tiles. These library tiles can be found here:
WAR 1.x
- CATALINA_HOME\webapps\CAST-Health\portal\resources*cmp_tiles_library.json*
- CATALINA_HOME\webapps\CAST-Health\portal\resources*app_tiles_library.json*
WAR ≥ 2.x
- CATALINA_HOME\webapps\CAST-Health\static\portal\resources*cmp_tiles_library.json*
- CATALINA_HOME\webapps\CAST-Health\static\portal\resources*app_tiles_library.json*
ZIP ≥ 2.x - The file is located in a compiled JAR file located at the root of the unpacked ZIP. This JAR file will need to be unpacked to find the .json files:
- <unpacked_jar>\BOOT-INF\classes\static\portal\resources*cmp_tiles_library.json*
- <unpacked_jar>\BOOT-INF\classes\static\portal\resources*app_tiles_library.json*
Viewing the changes in your browser
There is no need to restart the application server or application itself if you edit and save the cmp.json or app.json files: changes are immediate on saving the file. However, you may find that the changes are not immediately visible in the Health Dashboard. This is because the .json files are loaded into the browser’s cache, therefore CAST recommends that you empty your browser cache to force the changes to become visible.
If you are using Google Chrome the following tip can be used to automatically empty the browser cache:
- Tap F12 to open the Developer Tools window at the bottom of the page.
- Click the Settings icon (a cog) to the right of the Developer Tools window
- Tick the Disable cache (while DevTools is open) option and close the Settings window.
- In this state, when you then tap F12 followed by F5 to refresh the page, the browser cache will be automatically emptied.
Changing the positions of tiles
Tiles are displayed in the Health Dashboard in a left to right and top to bottom format within each “Area” (see below). In the .json file, Tiles are listed one after the other, therefore to move a Tile, you need to change its position in the .json file using copy/paste: the higher up the list within the “Area” you place the tile code, the higher up it will be displayed in the dashboard itself.
Structure of the .json
The .json file is divided into various different sections, each corresponding to an item, area or tile in the Health Dashboard:
Areas
There are three areas, each corresponding to the Overview, Trendsand Automated Enhancement Point (app.json only) sections you can see by default:

These are represented in the .json file as follows:
"id": 1,
"title": "Overview",
and:
"id": 3,
"title": "Trends",
and:
"id": 2,
"title": "Automated Enhancement Point",
Tiles
Within each Area, various Tiles (or Panels) are defined, for example:
            {
                "id": 5,
                "plugin": "QualityIndicatorResults",
                "color": "yellow",
                "parameters": {
                    "title": "Robustness",
                    "qualityIndicator": {"id": "ROBUSTNESS", "format": "0.00"},
                    "details":{
                        "ranges":[1.6,2.8,3.0,3.4]
                    },
                    "widget": "gauge"
                }
            },
Available parameters in .json
Global parameters
Please see Health Dashboard json configuration options for more information about the following parameters that can be defined in the cmp.json (and in the app.json) to provide dashboard wide parameterization (i.e, they are valid regardless of whether your dashboard contains one or multiple Applications):
    "title": "Health Dashboard",
    "language": "dev",
    "horizontalScroll": false,
    "confirmLogout": true,
	"persistNavigationFilters":true,
	"filtering":{
      "filterTags":false
    },
    "period": {
        "shift": true,
        "periods": [
            { "diff": 30, "units": "days" },
            { "diff": 3, "units": "months" },
            { "diff": 6, "units": "months" },
            { "diff": 12, "units": "months", "selected": true },
            { "diff": 2, "units": "years" },
            { "diff": 0, "units": "alltime" }
        ]
    }
QualityIndicatorResults (global)
These
global settings impact all tiles
configured as QualityIndicatorResult/s ,
allowing the configuration of grouping, value ranges, grade
labels, and color schemes.
"QualityIndicatorResults": {
	"groupBy": "technology",
	"ranges": [2.5, 2.9, 3.2],
	"gradeLabels":{},
	"colors": {
		"useGradient": false,
		"from": "#ff0242",
		"to": "#fbbb6e"
	}
},
Note that changing any of these parameters requires that the dashboard is restarted before the new values will be taken into account.
Parameter | Description |
|---|---|
| ranges / colors | Sets the color for the tiles where the color is not set in individual tiles. |
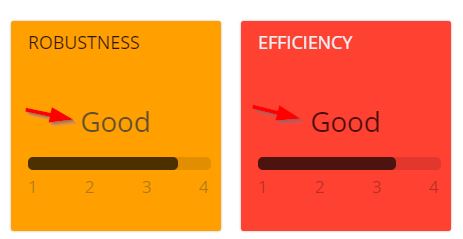
| gradeLabels | Allows a custom label to be added to a tile, working
together with the ranges parameter. By default
this parameter is not defined:
For example, with ranges set as follows: "ranges":[ 1.6, 2.4, 3.0, 3.4 ], ...you should set gradeLabels as follows: "gradeLabels":{
"1.6": "Poor",
"2.4": "Average",
"3.0": "Good",
"3.4": "Excellent"
},This will set gradeLabels in the UI as follows:
|
Tile parameters
A tile or panel represents the equivalent of a “plugin”. Each tile is composed of the following properties:
Parameter | Description |
|---|---|
| id | Represents the tile's unique id. This is a technical id used to identify the panels and MUST be unique throughout the .json file. |
| plugin | Represents the type of indicators to be displayed in the tile. The plugins that are available are listed below under Plugin parameters. |
| color | Optional parameter that describes the tile color theme to be used. A light grey color is used if none is defined. Colors are currently limited to:
|
| size | Optional parameter provides the ability to expand tiles in size (large and small):
|
| autoFit | Optional parameter that (when set to true - the default position) will truncate a plugin's title text if it is longer than the size of the tile (whether a large or small tile). Using this parameter may lead to visually less consistent dashboards. The default value is true, where the font size used for a plugin's title text will be reduced so that the title text fits the tile size. To deactivate the autoFit option, you need to specifically add the parameter to your plugin and set it to false. |
| parameters | This section contains plugin specific parameters. Please refer to each of the following plugin definitions under Plugin parameters for more information about this. |

Technical Size Measures parameters
Only available in app.json and only valid for ≤ 1.21 releases. This configuration has been removed in more recent releases.
Technical Size Measures govern the configurable display of Size indicators (Number of Critical Violations, Number of Code Lines, Number of Files etc.) for the drill down page available at Application level for the Technical Size tile (click to enlarge):

The list of indicators can be configured via the app.json file under the TechnicalSizeMeasures section:
| Parameter | Description |
|---|---|
| id | Represents the ID of the Technical Size indicator as defined in the CAST Assessment Model. |
| label | A text field used to display the name of the Technical Size indicator in the drill down page (click to enlarge): |
In this example we have added two additional indicators for Technical Debt of Added Violations (68901) and Technical Debt of Removed Violations (68902):
"TechnicalSizeMeasures": {
    "values": [
      {
        "id": 67011,
        "label": "Number of Critical Violations"
      },
      {
        "id": 10151,
        "label": "Number of Lines of Code"
      },
      {
        "id": 10154,
        "label": "Number of Files"
      },
      {
        "id": 10155,
        "label": "Number of Classes"
      },
      {
        "id": 10156,
        "label": "Number of Programs"
      },
      {
        "id": 10157,
        "label": "Number of Forms"
      },
      {
        "id": 10158,
        "label": "Number of SQL Artifacts"
      },
      {
        "id": 10163,
        "label": "Number of Tables"
      },
      {
        "id": 10152,
        "label": "Number of Artifacts"
      },
      {
        "id": 10107,
        "label": "Number of Comment Lines"
      },
      {
        "id": 10109,
        "label": "Number of Commented Out Code Lines"
      },
      {
        "id": 67901,
        "label": "Number of Critical Violations Added"
      },
      {
        "id": 67902,
        "label": "Number of Critical Violations Removed"
      },
      {
        "id": 67216,
        "label": "Number of Pending Violations"
      },
      {
        "id": 67217,
        "label": "Number of Solved Violations"
      },
      {
        "id": 67218,
        "label": "Number of Excluded Violations"
      },
      {
        "id": 68001,
        "label": "Technical Debt"
      },
	  {
        "id": 68901,
        "label": "Technical Debt of added Violations"
      },
	  {
        "id": 68902,
        "label": "Technical Debt of removed Violations"
      }
    ]
  },
E.g:

Plugin parameters
A plugin also has various different parameters as follows:
Note that:
- some plugins are named specifically for use in a specific .json file. In otherwords, a plugin will have two unique names, one for the cmp.json and one for the app.json. Plugins that function like this are documented as such below.
- plugins that function in the cmp.json file may not necessarily function in the app.json file (and vice-versa)
Common plugin parameters
| Parameter | Description |
|---|---|
| title | A title used to identify the tile. |
| mode | Determines how much detail will be presented in a tile. Not all tiles support the attribute.
|
| qualityIndicator or sizingMeasure | Represent the measurement data properties (typically the indicator identifier, some high level description and the value formatting).
|
scope | Enables a specific filter to be added to a tile (and related detail) to focus on Applications assigned to a defined tag and related category. Both sub-parameters are mandatory:
The parameter is global to tile configuration but only applies to the following plugins:
See Note about tags and categories as tile scopes in Health Dashboard - GUI. |
PortfolioListing
This tile is only available for use in the cmp.json file - in other words at multi-app/portfolio level.
Without scope:

{
    "id":20150818,
    "plugin": "PortfolioListing",
    "color": "grey-dark",
    "parameters":{
    	"title":"Number of applications"
    }
},
With scope on Tag and Category:

{
	"id":20160405,
	"plugin": "PortfolioListing",
	"color": "grey-dark",
	"parameters":{
		"title":"Number of applications",
		"scope":{
			"category":"Vendors",
			"tag":"Vendor 1"
		}
	}
},
Notification

An array whose first five items are shown in the area. Each item describes a notification:
- type: Describe the type of notifications.
- analysisSince - count the number of applications not analyzed in the selected period of time
- addedCount - count the number of applications added in the selected period of time
- sizingMeasureEvolution - count the number of applications with an evolution larger than the given threshold
- qualityIndicatorEvolution - count the number of applications with an evolution larger than the given threshold
- threshold used by sizingMeasure/qualityIndicator evolutions to filter application with small evolutions
- trend used by qualityIndicator evolutions to focus on improvement/degradations or sizingMeasure evolutions to focus on increase/decrease
- qualityIndicatorEvolution comes with qualityIndicator information:
- id is either: ARCHITECTURAL_DESIGN, CHANGEABILITY, DOCUMENTATION, PERFORMANCE, PROGRAMMING_PRACTICE, ROBUSTNESS, SEI_MAINTAINABILITY, SECURITY, TQI, TRANSFERABILITY
- id can also be a numerical ID corresponding to any CAST AIP metric
- description is whatever is required
- format is the format in which the value has to be displayed, it uses the the format defined in numeral.js (see http://numeraljs.com/ for available Numbers formats)
- sizingMeasureEvolution comes with a sizingMeasure information
- id is either: TECHNICAL_DEBT,LINES_OF_CODE, NUMBER_OF_ARTIFACTS, NUMBER_OF_COMMENT_LINES, NUMBER_OF_DECISION_POINTS, NUMBER_OF_FILES, AUTOMATED_IFPUG_FUNCTION_POINTS_ESTIMATION,BACKFIRED_IFPUG_FUNCTION_POINTS and CRITICAL_VIOLATIONS
- id can also be a numerical ID corresponding to any CAST AIP metric
- format is the format in which the value has to be displayed, it uses the the format defined in numeral.js (see http://numeraljs.com/ for available Numbers formats)
- description is whatever is required
Note that:
- ONLY five items will be shown in the tile itself, however, you can configure more than 5 items if you wish - the extra items will be displayed when you click the tile to drill down
- Any items with a value of 0 in the tile itself will not be displayed when you click the tile to drill down
Example (for cmp.json)
            {
                "id": 1000,
                "plugin": "Notification",
                "color": "orange",
                "size":"large",
                "parameters": {
                    "title": "Applications Fast Facts",
                    "notifications":[
                        {"type":"analysisSince"},
                        {"type":"addedCount"},
                        {"type":"sizingMeasureEvolution", "threshold":0.01, "trend":"increase", "sizingMeasure":{"id": "CRITICAL_VIOLATIONS", "format": "0", "description":"critical violations"}},
                        {"type":"sizingMeasureEvolution", "threshold":0.05, "trend":"increase", "sizingMeasure":{"id": "LINES_OF_CODE", "format": "0", "description":"lines of code"}},
                        {"type":"qualityIndicatorEvolution", "threshold":0.02, "trend":"degradation", "qualityIndicator":{"id": "PERFORMANCE", "format": "0", "description":"performance"}}
                    ]
                }
            }
BackgroundFactsResults / BackgroundFactsResult
Note that:
- when using this tile in the cmp.json file, please use BackgroundFactsResults
- when using this tile in the app.json file, please use BackgroundFactsResult

A tile that enables you to display Background Facts that you have manually configured and uploaded during the snapshot generation. The tile can display information about one metric that you have defined in the uploaded Background Facts file.
- backgroundFact: information about the indicator to display : its id, format and an optional description
- id refers to the Background Fact numerical ID as displayed in the Assessment Model in the CAST Management Studio (in recent versions, the IDs with a “metric_group” value of 6):

- format is the format in which the value has to be displayed, it uses the the format defined in numeral.js (see http://numeraljs.com/ for available Numbers formats)
- description is whatever is required
- url: the url field provides a simple means to link the drill down at detail level to some other web based information. Since the metrics comes from non-CAST sources, the external page containing information on the details of the metric, can be linked to here. If no url is provided, drill down cannot be achieved and a message will be displayed in tooltips on tile or charts whenever applicable:

- zoom: true or false to enable zooming in detail charts. Default value is true. The zoom feature works best when you have multiple Applications consolidated into your Health Dashboard - in this situation it can be difficult to read the grade details of each column (a column represents one Application). You can therefore use the zoom option to select (using the mouse) the Applications you want to zoom into.
- aggregation: (sum or average), tile will aggregate the application background fact values using sum or average - default value is sum. For example: if you have two Applications visible in the Health Dashboard and have configured a Background Fact (a Cost of 400 for example) for only one of the Applications, results will be displayed as follows:
- AVERAGE: A value of 200 will be displayed in the tile at Multi-application level (400 divided by 2) and in the tiles at Application level.
- SUM: A value of 400 will be displayed in the tile at Multi-application level and at Application level, 400 will be displayed for the Application for which the Background Fact has been uploaded and 0 for the Application for which no Background Fact has been uploaded.
Example (for cmp.json)
        {
            "id": 66002,
            "plugin": "BackgroundFactsResults",
            "color": "green",
            "parameters": {
                "url":"http://www.castsoftware.com",
                "aggregation":"sum",
                "title": "Cost",
                "backgroundFact": {
                	"id": "66002",
                	"format": "0.0",
                	"description": "Total cost value"
                }
            }
         },
Example (for app.json)
				{
                    "id": 39,
                    "plugin": "BackgroundFactsResult",
                    "color": "black",
                    "parameters": {
                        "title": "Number of incidents",
                        "url":"http://www.castsoftware.com",
                        "aggregation":"sum",
                        "backgroundFact": {
                            "id": "66061",
                			"format": "0,000a",
                            "description":""
                         }
                     }
                }
Example Background Facts configuration
In this example, there are two Applications present in the Health Dashboard. Background Facts have been configured and uploaded (see Background Facts and Business Value Metric upload for more information) for one of the Applications as shown below. The tile has been designed to show information about the Cost (66002) metric (see example plugin for cmp.json).
<?xml version="1.0" encoding="iso-8859-1" ?>
<DATA model="Central Model" version="1.0.0.17" scope="Productivity">

<!-- Module Definition -->
<DSS_IN_OBJECTS>
      <OBJECT_NAME>SEVRES full content</OBJECT_NAME>
      <OBJECT_TYPE_ID>20000</OBJECT_TYPE_ID>
      <OBJECT_ID>10</OBJECT_ID>
</DSS_IN_OBJECTS>

<!-- RESULTS : 66061 : Business Value for Module -->
<DSS_IN_METRIC_RESULTS>
    <METRIC_ID>66061</METRIC_ID>
    <METRIC_NUM_VALUE>4</METRIC_NUM_VALUE>
    <OBJECT_ID>10</OBJECT_ID>
</DSS_IN_METRIC_RESULTS>

<!-- RESULTS : 66001 : Effort for Module -->
<DSS_IN_METRIC_RESULTS>
    <METRIC_ID>66001</METRIC_ID>
    <METRIC_NUM_VALUE>10.5</METRIC_NUM_VALUE>
    <OBJECT_ID>10</OBJECT_ID>
</DSS_IN_METRIC_RESULTS>

<!-- RESULTS : 66002 : Cost for Module -->
<DSS_IN_METRIC_RESULTS>
    <METRIC_ID>66002</METRIC_ID>
    <METRIC_NUM_VALUE>400</METRIC_NUM_VALUE>
    <OBJECT_ID>10</OBJECT_ID>
</DSS_IN_METRIC_RESULTS>

</DATA>
BackgroundFactsEvolution
Note that this tile can be used at multi (cmp.json) and single (app.json) Application level.

A tile that enables you to display the evolution of Background Facts that you have manually configured and uploaded during the snapshot generation. The tile can display information about one metric that you have defined in the uploaded Background Facts file.
- backgroundFact: see the BackgroundFactsResult/BackgroundFactsResults tile above for more info.
- aggregation; see the BackgroundFactsResult/BackgroundFactsResults tile above for more info.
- widget: provides the rendering type (number for number variation, line or spline for trend chart representation: line uses with straight lines whereas spline provides smooth transitions between points)
- selectedApplicationCount defines the number of applications selected by default in the drill down at detail level page when the tile is defined at multi-application level (cmp.json).
Clicking the tile
When defined at single application level (app.json), clicking a tile will by default display the evolution of TQI. When defined at multi-application level (cmp.json), clicking a tile will display the following Background Fact detail for the Applications in scope:

Example (for cmp.json or app.json):
{
                "id": 660011,
                "plugin": "BackgroundFactsEvolution",
                "color": "purple",
                "parameters": {
                    "widget":"number",
                    "aggregation":"average",
                    "title": "Effort",
                    "backgroundFact": {"id": "EFFORT","format": "0,000"}
                }
            },
            {
                "id": 660012,
                "plugin": "BackgroundFactsEvolution",
                "color": "purple",
                "parameters": {
                    "widget":"spline",
                    "aggregation":"sum",
                    "title": "Effort",
                    "backgroundFact": {"id": 66001,"format": "0,000"}
                }
            }
BackgroundFactAndQualityIndicatoryBySizingMeasureResults
Please note that by default this plugin (tile) does not appear in any default .json files. If you need to use it, it will only function at Multi-application level (cmp.json). An example of the tile is given below.

qualityIndicator: information about the indicator to display (as x axis) : its id, format and an eventual description
id is either: ARCHITECTURAL_DESIGN, CHANGEABILITY, DOCUMENTATION, PERFORMANCE, PROGRAMMING_PRACTICE, ROBUSTNESS,SEI_MAINTAINABILITY, SECURITY, TQI, TRANSFERABILITY
id can also be a numerical ID corresponding to any CAST AIP metric
format is the format in which the value has to be displayed, it uses the the format defined in numeral.js (see http://numeraljs.com/ for available Numbers formats)
description is whatever is required
sizingMeasure: information about the indicator to display (as bubble size): its id, format and an eventual description
- id is either: TECHNICAL_DEBT, LINES_OF_CODE, NUMBER_OF_ARTIFACTS, NUMBER_OF_COMMENT_LINES, NUMBER_OF_DECISION_POINTS, NUMBER_OF_FILES, AUTOMATED_IFPUG_FUNCTION_POINTS_ESTIMATION, BACKFIRED_IFPUG_FUNCTION_POINTS and CRITICAL_VIOLATIONS
- id can also be a numerical ID corresponding to any CAST AIP metric
- format is the format in which the value has to be displayed, it uses the the format defined in numeral.js (see http://numeraljs.com/ for available Numbers formats)
- description is whatever is required
backgroundFact: information about the indicator to display (as y axis) : its id, format and an eventual description
id is either: BUSINESS_VALUE, COST, DELIVERY_FEATURE_REQUESTS, EFFORT, ENHANCEMENT_FUNCTION_POINTS, PENDING_FEATURE_REQUESTS, and PENDING_FIXES
id can also be a numerical ID corresponding to any CAST AIP metric
format is the format in which the value has to be displayed, it uses the the format defined in numeral.js (see http://numeraljs.com/ for available Numbers formats)
description is whatever is required
chartSettings: information about the displayed graph. It is described by the highcharts library (cf. http://api.highcharts.com/highcharts for available description)
- xAxis and yAxis refers to the chart axis
- plotLines: An array of lines streching across the plot area, marking a specific value on one of the axes:
- value: the position of the line in axis units.
- color: the color of the plot band.
- label: text labels for the plot bands
- align: horizontal alignment (“left”, “center” or “right”)
- text: The string text itself. A subset of HTML is supported.
- textAlign: The text alignment for the label determines how the text is aligned against its anchor point. Possible values are “left”, “center” and “right”.
- verticalAlign: Vertical alignment of the label relative to the plot band. Can be one of “top”, “middle” or “bottom”. Defaults to top.
- plotBands: An array of colored bands stretching across the plot area marking an interval on the axis:
- from: the start position of the plot band in axis units.
- to: the end position of the plot band in axis units.
- color: the color of the plot band.
- label: text labels for the plot bands
- align: horizontal alignment (“left”, “center” or “right”)
- text: The string text itself. A subset of HTML is supported.
- textAlign: The text alignment for the label determines how the text is aligned against its anchor point. Possible values are “left”, “center” and “right”.
- verticalAlign: Vertical alignment of the label relative to the plot band. Can be one of “top”, “middle” or “bottom”. Defaults to top.
Example:
			{
                "id": 10203,
                "plugin": "BackgroundFactAndQualityIndicatoryBySizingMeasureResults",
                "color": "purple",
                "parameters": {
                    "title": "Lines of Code - Effort",
                    "order": "descending",
                    "qualityIndicator": {"id": "TQI", "format": "0.00", "description": "TQI"},
                    "sizingMeasure": {"id": "LINES_OF_CODE", "format": "0,000a", "description": "Lines of Code"},
                    "backgroundFact": {"id": "EFFORT", "format": "0.00", "description": "Effort"},
                    "chartSettings": {
                        "xAxis": {
                            "plotLines": [
                                { "value": 3, "label":{"text":"TQI=3"} }
                            ]
                        },
                        "yAxis": {
                            "plotLines": [
                                { "value": 3.0, "label":{"text":"Risk=3"} }
                            ]
                        }
                    }
                }
            }
CriticalQualityRulesRatios / CriticalQualityRuleRatio
Note that:
- when using this tile in the cmp.json file, please use CriticalQualityRulesRatios
- when using this tile in the app.json file, please use CriticalQualityRuleRatio

This tile shows the top 5 critical rules at Application or multi-Application level, together with:
- Checked column: the number of times the rule has been checked - i.e. the number of objects checked by the Quality Rule
- Failed (%)orFailed (#) column: the percentage or number of checks that have failed - i.e. percentage or number of objects checked by the Quality Rule that violate the Quality Rule
Configuration:
type: Describe the type of notifications - set totopRules
count: the number of lines displayed. 5 is the optimized size for the height of the tile
order: the ordering of the Quality Rules represented in the tile. This can be descending or ascending, and is based on the number of failed checks
format: the format of the compliance value: it uses the the format defined in numeral.js (see http://numeraljs.com/ for available Numbers formats)
mode: two options are possible:
- “ratio”: a Failed (%) column will display a percentage of the checks that have failed - i.e. percentage of objects checked by the Quality Rule that violate the Quality Rule.
- “number”: a Failed (#) column will display the number of the checks that have failed - i.e. the number of objects checked by the Quality Rule that violate the Quality Rule.
loadLimit: Compared to other tiles, this tile tends to involve large amount of data when the application scope increases, hence can quickly prove to be performance inefficient; theloadLimit option defines a limit for the number of applications: when there are less Applications than the loadLimit value, then the contents of the tile will be loaded. When there are more Applications than the loadLimit value, then the contents of the tile will not be loaded and a message will state this.
Example (for cmp.json):
            {
                "id": 14,
                "plugin": "CriticalQualityRulesRatios",
                "size":"large",
                "color": "grey-dark",
                "parameters": {
                    "loadLimit": 60,
                    "title": "Top 5 critical rules",
                    "count": 5,
                    "order": "descending",
                    "format": "0,000",
                    "mode": "ratio"
                }
            }
Example (for app.json):
                {
                    "id": 107,
                    "plugin": "CriticalQualityRuleRatio",
                    "color": "grey-dark",
                    "size":"large",
                    "parameters": {
                        "type":"topRules",
                        "title": "Top Critical Rules",
                        "count": 5,
                        "format":"0,000",
                        "order": "descending",
                        "mode": "ratio"
                    }
                }
CriticalViolationsPerHealthFactor

The critical violations per health factor module provides a critical violations count for a given business criterion:
- count: the number of lines displayed. 5 is the optimized size for the height of the tile. This parameter is only taken into account for topRiskiest tile types.
- order: the ordering of the data represented in the tile. This can be descending or ascending, and is based on the sizing measure
- qualityIndicator: this is identical to the indicator of the singleQualityIndicator tile :
id is either:ARCHITECTURAL_DESIGN, CHANGEABILITY, DOCUMENTATION, PERFORMANCE, PROGRAMMING_PRACTICE, ROBUSTNESS,SEI_MAINTAINABILITY, SECURITY, TQI, TRANSFERABILITY
id can also be a numerical ID corresponding to any CAST AIP metric
description is whatever is required
format is the format in which the value has to be displayed, it uses the the format defined in numeral.js (see http://numeraljs.com/ for available Numbers formats)
InfoFrom, v. ≥ 2.5.0-funcrel the mode option is available.
**mode:**the mode in which the value needs to be displayed:
- grade: this will provide a value from 1 - 4
- violations: this will provide the total number of violations
- compliance: this will provide the percentage value of compliance to the chosen metric
Example (for cmp.json)
			{
                "id": 10,
                "plugin": "CriticalViolationsPerHealthFactor",
                "color": "green",
                "size":"large",
                "parameters": {
                    "type":"topRiskiest",
                    "title": "Top 5 riskiest Applications",
                    "count": 5,
                    "order": "descending",
                    "qualityIndicator": {"id": "PERFORMANCE", "format": "0.00", "description": "Performance"},
                    "sizingMeasure": {"id": "CRITICAL_VIOLATIONS", "format": "0,000a", "description": "Critical Violations"}
                }
            },
Example (for app.json)
                {
                    "id": 106,
                    "plugin": "CriticalViolationsPerHealthFactor",
                    "color": "green",
                    "size":"large",
                    "parameters": {
                        "type":"topRiskiest",
                        "title": "Top riskiest modules",
                        "count": 5,
                        "order": "descending",
                        "qualityIndicator": {"id": "PERFORMANCE", "format": "0.00", "description": "Performance"}
                    }
                }
FunctionalWeightMeasureResult / FunctionalWeightMeasureResults
InfoNote that:
- when using this tile in the cmp.json file, please use FunctionalWeightMeasureResults
- when using this tile in the app.json file, please use FunctionalWeightMeasureResult

Example (for cmp.json):
{ "id": 10201, "plugin": "FunctionalWeightMeasureResults", "color": "blue", "parameters": { "title": "Functional & Enhancement Size", "functionalWeightMeasure": { "id": "AUTOMATED_IFPUG_FUNCTION_POINTS_ESTIMATION", "format": "0,000", "description": "OMG-Compliant Automated FPs" } } }InfoNote that when drilling down, a table is displayed listing the applications.
Example (for app.json):
InfoNote that when drilling down, a table lists all the Applications that are not included in the AFP measure (essentially all the Applications not using a CAST EFP license):

QualityIndicatorBySizingMeasureResult / QualityIndicatorBySizingMeasureResults
InfoNote that:
- when using this tile in the cmp.json file, please use QualityIndicatorBySizingMeasureResults
- when using this tile in the app.json file, please use QualityIndicatorBySizingMeasureResult

- type: topRiskiest for a table representation of the top N riskiest with regard to quality and sizing indicators/ treemap for a global view of the selected applications.
- count: the number of lines displayed. 5 is the optimized size for the height of the tile. This parameter is only taken into account for topRiskiest tile types.
- order: the ordering of the data represented in the tile. This can be descending or ascending, and is based on the sizing measure
- qualityIndicator: this is identical to the indicator in the singleQualityIndicator tile:
- id is either: ARCHITECTURAL_DESIGN, CHANGEABILITY, DOCUMENTATION, PERFORMANCE, PROGRAMMING_PRACTICE, ROBUSTNESS, SEI_MAINTAINABILITY, SECURITY, TQI, TRANSFERABILITY
- id can also be a numerical ID corresponding to any CAST AIP metric
- description is whatever is required
- format is the format in which the value has to be displayed, it uses the the format defined in numeral.js (see http://numeraljs.com/ for available Numbers formats)
- sizingMeasure: this is identical of the indicator of the size and criticalViolations tiles :
- id is either:TECHNICAL_DEBT, LINES_OF_CODE, NUMBER_OF_ARTIFACTS, NUMBER_OF_COMMENT_LINES, NUMBER_OF_DECISION_POINTS, NUMBER_OF_FILES, NUMBER_OF_FUNCTION_POINTS, NUMBER_OF_BACKFIRED_FUNCTION_POINTS and CRITICAL_VIOLATIONS.
- id can also be a numerical ID corresponding to any CAST AIP metric
- description is whatever is required
- format is the format in which the value has to be displayed, it uses the the format defined in numeral.js (see http://numeraljs.com/ for available Numbers formats)
- treemapColors: defines the colours displayed in the tile (for example for TQI qualityIndicator)
- “ranges”:[1,2,3,4] defines the number of colour ranges
- “colors”:["#ff3600","#ff0242","#fbbb6e","#3dc680"] defines the colour for each range (must have the same number of colours as ranges)
InfosizingMeasure
Note that at multi Application level (i.e. configuration in the cmp.json file), the following are also available for use with the sizingMeasure item: AUTOMATED_IFPUG_FUNCTION_POINTS_ESTIMATION, UNADJUSTED_DATA_FUNCTION_POINTS, UNADJUSTED_TRANSACTIONAL_FUNCTION_POINTS, ADDED_FUNCTION_POINTS, ADDED_DATA_FUNCTION_POINTS, ADDED_TRANSACTIONAL_FUNCTION_POINTS, MODIFIED_FUNCTION_POINTS, MODIFIED_DATA_FUNCTION_POINTS, MODIFIED_TRANSACTIONAL_FUNCTION_POINTS, DELETED_FUNCTION_POINTS, DELETED_DATA_FUNCTION_POINTS, DELETED_TRANSACTIONAL_FUNCTION_POINTS, UNCHANGED_FUNCTION_POINTS, UNCHANGED_DATA_FUNCTION_POINTS, UNCHANGED_TRANSACTIONAL_FUNCTION_POINTS
Be extra careful with these metrics as they have values only if you have the EFP license key, and if all Applications do not have function points, the tile can exhibit display issues (squares can be very small in an empty space). The tile will only display Applications that have results for configured indicators.
Example (for cmp.json)
            {
                "id": 3,
                "plugin": "QualityIndicatorBySizingMeasureResults",
                "size":"large",
                "color": "purple",
                "parameters": {
                    "type":"treemap",
                    "title": "Applications Map",
                    "order": "descending",
                    "qualityIndicator": {"id": "TQI", "format": "0.00", "tooltipFormat":"0.00", "description": "Total Quality Index"},
                    "sizingMeasure": {"id": "LINES_OF_CODE", "format": "0,000.0a", "tooltipFormat":"'0,000", "description": "Lines of Code"},
                    "treemapColors": {
                        "ranges":[1,2,3,4],
                        "colors":["#ff3600","#ff0242","#fbbb6e","#3dc680"]
                    }
                }
            },
Example (for app.json)
                {
                    "id": 101,
                    "plugin": "QualityIndicatorBySizingMeasureResult",
                    "size":"large",
                    "color": "purple",
                    "parameters": {
                        "type":"treemap",
                        "title": "Security Mapping",
                        "order": "descending",
                        "qualityIndicator": {"id": "SECURITY", "format": "0.00", "tooltipFormat":"0.00", "description": "Security"},
                        "sizingMeasure": {"id": "LINES_OF_CODE", "format": "0,000.0a", "tooltipFormat":"'0,000", "description": "Lines of Code"},
                        "treemapColors": {
                            "ranges":[1,2,3,4],
                            "colors":["#ff0242","#FF5B2B","#fbbb6e","#3dc680"]
                        }
                    }
                },
QualityIndicatorResult / QualityIndicatorResults
InfoNote that:
- when using this tile in the cmp.json / cmp-ISO.json file, please use QualityIndicatorResults
- when using this tile in the app.json file, please use QualityIndicatorResult

- qualityIndicator: information about the indicator to display : its id, format and an optional description
- id is one of the following: ARCHITECTURAL_DESIGN, CHANGEABILITY, DOCUMENTATION, PERFORMANCE, PROGRAMMING_PRACTICE, ROBUSTNESS, SEI_MAINTAINABILITY, SECURITY, TQI, TRANSFERABILITY - can also be a numerical ID such as 66031 (Programming Practices)
- format is the format in which the value has to be displayed, it uses the the format defined in numeral.js (see http://numeraljs.com/ for available Numbers formats)
- technicalId is the ID of the parent Technical Criteria, for example “61003” would display “Programming Practices - OO Inheritance and Polymorphism” in the tile. Functions at Portfolio and Application level.
- description free text of whatever is required
- details provide parameters dedicated towards drill down page views:
- ranges: range used to separate indicator groups displayed in detail view. Default is [2,3] to produce : [indicator < 2, 2 <= indicator < 3, 3<= indicator]
- colors: from hex code color to hex code color. from provides the grade 1 white to provide the grade 4 color values. Default values are #CE2029 for grade 1 and #28AC1B for grade 4. The choice of a gradient or plain colors can be made through the useGradient parameter. Default value is false.
- widget provides graphical representations of the indicator (e.g. gauge, donut or riskGauge)
- If widget is set to riskGauge, then the gauge will display color based on the indicator grade with regard to riskGauge configuration (thresholds and colors). The tile color theme is restricted to grey-light and grey-dark when using this widget. Default color is grey-dark.
- riskGauge: can be set globally in the top level QualityIndicatorResults global configuration and can be overridden in the tile parameters. Parameters are used if the widget parameter is set to riskGauge
- thresholds: define the thresholds used to qualify the grade risk; default values are: [2, 3, 3.99] meaning high-risk:1 to 2, risk:2 to 3, low risk:3 to 3.99, and very low risk over
- colors: define the colors using hexidecimal color numbers according to the number of thresholds (remember that one more color is always required than the number of thresholds defined, for example: defining 3 thresholds will result in 4 areas, hence 4 colors are required)
- icon: boolean to display (true) an icon next to the tile title, false by default.
- zoom: true or false to enable zooming in detail charts. Default value is true. The zoom feature works best when you have multiple Applications consolidated into your Health Dashboard - in this situation it can be difficult to read the grade details of each column (a column represents one Application). You can therefore use the zoom option to select (using the mouse) the Applications you want to zoom into.
InfoParameters are available panel per panel. Some general parameters can be set on the top most level of the json structure through the “QualityIndicatorResults” field. The parameters set there involve the details fields such as ranges, color or riskGauge.
Example (for cmp.json)
{
    "id": 999,
    "plugin": "QualityIndicatorResults",
    "color": "grey-dark",
    "parameters": {
    	"title": "Programming Practices",
    	"widget": "gauge",
    	"qualityIndicator": {
        	"id": "66031",
        	"format": "0.00",
        	"description": ""
    	}
    }
},
Example (for app.json)
{
    "id": 999,
    "plugin": "QualityIndicatorResult",
    "color": "yellow",
    "parameters": {
    	"title": "Programming Practices",
    	"widget": "gauge",
    	"qualityIndicator": {
        	"id": "66031",
        	"format": "0.00"
			"description": ""
    	}
    }
},
Example for a riskGauge at the start of the file in app.json or cmp.json
"QualityIndicatorResults" : {
	"ranges": [2.5, 2.9, 3.2],
	"riskGauge": {
		"thresholds":[1,2,2.7,3.2],
		"colors":["#02eff4","#ff4b02","#025af4","#7fc4b2","#eff402"]
	}
},
QualityIndicatorEvolution

- qualityIndicator: information about the indicator to display: its id, format and an optional description
id is either: ARCHITECTURAL_DESIGN, CHANGEABILITY, DOCUMENTATION, PERFORMANCE, PROGRAMMING_PRACTICE, ROBUSTNESS, SEI_MAINTAINABILITY, SECURITY, TQI, TRANSFERABILITY
id can also be a numerical ID corresponding to any CAST AIP metric
description is whatever is required
format is the format in which the value has to be displayed, it uses the the format defined in numeral.js (see http://numeraljs.com/ for available Numbers formats)
widget provides the rendering type (number for number variation, line or spline for trend chart representation - line uses straight lines whereas spline provides smooth transitions between points)
InfoFrom, v. ≥ 2.5.0-funcrel the mode option is available.
- **mode:**the mode in which the value needs to be displayed:
- grade: this will provide a value from 1 - 4
- violations: this will provide the total number of violations
- compliance: this will provide the percentage value of compliance to the chosen metric
Example (for cmp.json)
            {
                "id": 103,
                "plugin": "QualityIndicatorEvolution",
                "color": "green",
                "parameters": {
                    "widget":"spline",
                    "title": "Security",
                    "qualityIndicator": {
						"id": "SECURITY",
						"format": "0.00"
					}
                }
            },
Example (for app.json)
                {
                    "id": 201,
                    "plugin": "QualityIndicatorEvolution",
                    "color": "blue",
                    "parameters": {
                        "widget":"number",
                        "title": "TQI",
                        "qualityIndicator": {
							"id": "TQI",
							"format": "0.00"
						}
                    }
                },
SizingMeasureEvolution

- sizingMeasure: information about the indicator to display : its id, format and an optional description
- id is either: TECHNICAL_DEBT, LINES_OF_CODE, NUMBER_OF_ARTIFACTS, NUMBER_OF_COMMENT_LINES, NUMBER_OF_DECISION_POINTS, NUMBER_OF_FILES, NUMBER_OF_FUNCTION_POINTS, NUMBER_OF_BACKFIRED_FUNCTION_POINTS, CRITICAL_VIOLATIONS, OMG_TECHNICAL_DEBT_ISO, OMG_TECHNICAL_DEBT_CISQ and OMG_TECHNICAL_DEBT
- id can also be a numerical ID corresponding to any CAST AIP metric
- description is whatever is required
- format is the format in which the value has to be displayed, it uses the the format defined in numeral.js (see http://numeraljs.com/ for available Numbers formats)
- widget provides the rendering type (number for number variation, line or spline for trend chart representation - line uses straight lines whereas spline provides smooth transitions between points)
InfoWhen using ≤ 1.22 AND when defined at single application level (app.json) AND when a custom ID has been used for the “id” value, then you will need to make some further configuration changes as follows to correctly display data **when the tile is clicked.**Edit the following file with a text editor:
CATALINA_HOME\webapps\CAST-Health\portal\resources\internal\app-navigation.json≥ 1.22
Search for the “id”: “sizeIndicators”, section in the file and then locate the **“indicators”: [**section:
{
	"id": "sizeIndicators",
	"plugin": "SizeIndicators",
	"parameters": {
		"title": "Size Indicators",
		"format": "0,000",
		"description": "",
		"indicators": [
			{
				"id": "10151",
				"label": "Lines of code",
				"selected": true
			},
			{
				"id": "10152",
				"label": "Artifacts",
				"selected": false
			},
			{
				"id": "10202",
				"label": "Functional size",
				"selected": false
			},
			{
				"id": "10450",
				"label": "Enhancement size",
				"selected": false
			}
		]
	}
},
Add a new section to match the custom ID that you are working with. Don’t forget to add a comma at the end of the previous section. For example:
			{
				"id": "10450",
				"label": "Enhancement size",
				"selected": false
			},
		    {
			"id": "<custom_ID>",
			"label": "<custom_label>",
			"selected": false
		    }
		]
	}
},
Save the file when you have completed the update. You may need to restart Apache Tomcat before the drill down data is displayed.
≤ 1.21
Search for the “id”: “evolution”, section in the file and then locate the **“id”: “sizeIndicators”,**section:
"id": "evolution",
"plugin": "Evolution",
"parameters": {
	"title": "Trends",
	"description": "Trends",
	"groups": [
	    {
		"id": "sizeIndicators",
		"description": "Size Indicators",
		"indicators": [
		    {
			"description": "Lines of code",
			"id": "10151",
			"format": "0,000",
			"selected": true
		    },
		    {
			"description": "Comment lines",
			"id": "10107",
			"format": "0,000",
			"selected": false
		    },
		    {
			"description": "Number of artifacts",
			"id": "10152",
			"format": "0,000",
			"selected": false
		    },
		    {
			"description": "Number of files",
			"id": "10154",
			"format": "0,000",
			"selected": false
		    },
		    {
			"description": "Critical violations",
			"id": "67011",
			"format": "0,000",
			"selected": false
		    },
		    {
			"description": "Technical debt",
			"id": "68001",
			"format": "$0,000",
			"selected": false
		    }
		]
	 },
Immediately after the “Technical debt” section, add a new section to match the custom ID that you are working with. Don’t forget to add a comma at the end of the “Technical debt” section. For example:
		    {
			"description": "Technical debt",
			"id": "68001",
			"format": "$0,000",
			"selected": false
		    },
		    {
			"description": "Custom ID Name",
			"id": "<custom_ID>",
			"format": "0,000",
			"selected": false
		    }
Save the file when you have completed the update. You may need to restart Apache Tomcat before the drill down data is displayed.
Example (for cmp.json)
            {
                "id": 100,
                "plugin": "SizingMeasureEvolution",
                "color": "grey-dark",
                "parameters": {
                    "title": "Technical Debt",
                    "sizingMeasure": {"id": "TECHNICAL_DEBT", "format": "$0,000.0a"}
                }
            },
Example (for app.json)
                {
                    "id": 202,
                    "plugin": "SizingMeasureEvolution",
                    "color": "orange",
                    "parameters": {
                        "widget":"number",
                        "title": "Technical Debt",
                        "sizingMeasure": {"id": "TECHNICAL_DEBT", "format": "$0,000.0a"}
                    }
                },
SizingMeasureResult / SizingMeasureResults
InfoNote that:
- when using this tile in the cmp.json file, please use SizingMeasureResults
- when using this tile in the app.json file, please use SizingMeasureResult

- sizingMeasure: information about the indicator to display : its id, format and an optional description
- id is either: TECHNICAL_DEBT, LINES_OF_CODE, NUMBER_OF_ARTIFACTS, NUMBER_OF_COMMENT_LINES, NUMBER_OF_DECISION_POINTS, NUMBER_OF_FILES, NUMBER_OF_FUNCTION_POINTS, NUMBER_OF_BACKFIRED_FUNCTION_POINTS, CRITICAL_VIOLATIONS**, OMG_TECHNICAL_DEBT_ISO, OMG_TECHNICAL_DEBT_CISQ** and OMG_TECHNICAL_DEBT
- id can also be a numerical ID corresponding to any CAST AIP metric
- description is whatever is required
- format is the format in which the value has to be displayed, it uses the the format defined in numeral.js (see http://numeraljs.com/ for available Numbers formats)
- zoom: true or false to enable zooming in detail charts. Default value is true. The zoom feature works best when you have multiple Applications consolidated into your Health Dashboard - in this situation it can be difficult to read the grade details of each column (a column represents one Application). You can therefore use the zoom option to select (using the mouse) the Applications you want to zoom into.
Example (for cmp.json)
            {
                "id": 12,
                "plugin": "SizingMeasureResults",
                "color": "orange",
                "parameters": {
                    "title": "Critical violations",
                    "mode":"terse",
                    "sizingMeasure": {"id": "CRITICAL_VIOLATIONS", "format": "0,000"}
                }
            },
Example (for app.json)
                {
                    "id": 102,
                    "plugin": "SizingMeasureResult",
                    "color": "green",
                    "parameters": {
                        "title": "Size",
                        "sizingMeasure": {
                            "id": "LINES_OF_CODE",
                            "format": "0,000",
                            "description": "Lines of Code"
                        }
                    }
                },
QualityStandards (Top Priority)
InfoThis tile requires that the following extensions are installed BEFORE a snapshot is generated - otherwise no results will be generated:
 Info
InfoFrom 2.7.0 onwards, this tile is not provided out of the box it has to be manually configured.
This tile is available at Portfolio and Application level and displays the number of violations for rules that have the tag AIP-TOP-PRIORITY. Typically, rules with this tag are provided in the extension System Level Rules, but other rules may also have this tag.
- id: cmp.json (213) / app.json (108)
- plugin: QualityStandards
- color: light-red
- parameters:
- title: Top Priority
- qualityStandards:
- id: AIP-TOP-PRIORITY
- format: 0,000 - the format in which the value has to be displayed, it uses the the format defined in numeral.js (see http://numeraljs.com/ for available Numbers formats)
- description: Violations (not shown in the dashboard)
Drill down behaviour
Clicking on the tile will bring you to the System Level Violations list:
Click to enlarge

Example (for cmp.json)
{
	"id": 213,
	"plugin": "QualityStandards",
	"color": "light-red",
	"parameters": {
		"title": "Top Priority",
		"qualityStandards": {
			"id": "AIP-TOP-PRIORITY",
			"format": "0,000",
			"description": "Violations"
		}
	}
},
Example (for app.json)
{
	"id": 108,
	"plugin": "QualityStandards",
	"color": "light-red",
	"parameters": {
		"title": "Top Priority",
		"qualityStandards": {
			"id": "AIP-TOP-PRIORITY",
			"format": "0,000",
			"description": "Violations"
		}
	}
},
QualityStandards (Custom tile)
Info- Custom tiles are available in version ≥ 1.11.0.
- For Quality Standards tags, the extension Quality Standards Mapping must be installed prior to generating the snapshot, otherwise no tag data is available and no results will be returned.
- Custom tags can be manually injected at any time - results will be available immediately.
A tile (not available by default) that enables you to display the number of violations (critical/non-critical violations according to the filter enabled) for rules tagged with a specific Quality Standards tagor manually injected custom tag. Valid for both Portfolio and Application levels with the same configuration.

- id: each custom tile must have its own unique ID within cmp.json / app.json
- plugin: must be QualityStandards
- color: tile color
- parameters:
- title: Title of the tile
- qualityStandards:
- id: the Quality Standards or custom tag you wish to view in the tile
- description: a free text field to describe what the tile shows (not shown in the dashboard)
- format: the format in which the value has to be displayed, it uses the the format defined in numeral.js (see http://numeraljs.com/ for available Numbers formats)
Example
This example will display a tile showing the number of violations from rules tagged with the custom CUSTOM-TOP-PRIORITY-RULES tag:
{
	"id": 2103,
	"plugin": "QualityStandards",
	"color": "green",
	"parameters": {
		"title": "My Top Priority",
		"qualityStandards": {
			"id": "CUSTOM-TOP-PRIORITY-RULES",
			"format": "0,000",
			"description": "Violations"
			}
	}
},
Drill down behaviour
Clicking on any of these tiles will display a list of the rules that have been tagged with the specified tag:
Click to enlarge

IndustryStandards / IndustryStandard
Info- Available in Dashboards ≥ 1.17.
- When using this tile in the cmp.json file, please use IndustryStandards
- When using this tile in the app.json file, please use IndustryStandard
This tile is designed to display data generated by the following CAST extensions that provide data about industry standards. These are:
You can display results in grade format or in number of violations format:

- id: each custom tile must have its own unique ID within cmp.json / app.json
- plugin: must be IndustryStandards (cmp.json) / IndustryStandard (app.json)
- color: tile color
- parameters:
- type: One of the following depending on the industry standard you are measuring:
- CISQ
- MIPS
- ISO-5055
- OWASP-2013
- OWASP-2017
- title: Title of the tile - free text
- widget: (only when you require grade format results) - gauge or donut
- industryStandard:
- id: the industryStandard ID defined by the extension (see the extension documentation for more information).
- indexID: this ID should be the industryStandard parent Business Criterion index. This ensures that drill down from the tile functions correctly. For example, if you have configured the tile to show CISQ-Performance-Efficiency (****1062102), you should configure the indexID to 1062100 (the parent Business Criterion index)
- **mode:**the mode in which the value needs to be displayed:
- grade: this will provide a value from 1 - 4
- violations: this will provide the total number of violations
- compliance: this will provide the percentage value of compliance to the chosen IndustryStandard
- format: the format in which the value has to be displayed, this uses the the format defined in numeral.js (see http://numeraljs.com/ for available Numbers formats):
- 0.00 for grade format
- 0,000 for violationsformat
- 0.0% for compliance format
- description: an optional free text field to describe what the tile shows (not shown in the dashboard)
- type: One of the following depending on the industry standard you are measuring:
Example for cmp.json
{
  "id": 1234,
  "plugin": "IndustryStandards",
  "color": "black",
  "parameters": {
	"type": "CISQ",
    "title": "CISQ-Security Index",
    "widget": "gauge",
    "industryStandard": {
		"id": "1062166",
		"indexID": "1062100",
		"mode": "grade",
		"format": "0.00",
		"description": "CISQ-Security in grade format"
    }
  }
}
Example for app.json
{
  "id": 1236,
  "plugin": "IndustryStandard",
  "color": "orange",
  "parameters": {
	"type": "OWASP-2013",
	"title": "OWASP-2013 Index",
    "industryStandard": {
		"id": "1062300",
		"indexID": "1062300",
		"mode": "violations",
		"format": "0,000",
		"description": "OWASP-2013 in violation format"
    }
  }
}
Drill down behaviour
Clicking on any of these tiles will display a list of the rules that have been tagged with the specified standard as provided by the extension. Compliance percentage is also displayed in a “bubble”:
Click to enlarge
Compliance percentage at single Application level Compliance percentage at multi Application level ExternalLink
This tile (not available by default) provides the ability to define external URLs (e.g. to other data dashboards) in a tile:

- color: tile color
- parameters:
- title the short message to display in tile
- url the hyperlink to follow
Example (for cmp.json and app.json)
{
    "id": 100,
    "plugin": "ExternalLink",
    "color": "red",
    "parameters": {
        "title": "Tackle your Technical Debt",
        "url":"http://www.castsoftware.com"
    }
},
ExternalLinkWithImage
This tile (not provided “out-of-the box”) shows a custom external URL (for example a link to a different dashboard) and a custom background image (rather than a plain colour). The tile configuration is as follows:

- color: tile color
- parameters:
- titlethe short message to display in tile
- url the hyperlink to follow
- imageurl url to the image you want to use
Example (for cmp.json and app.json)
{
    "id": 1002015,
    "plugin": "ExternalLinkWithImage",
    "color": "red",
    "parameters": {
    "title": "Tackle your Technical Debt",
    "url":"http://www.castsoftware.com",
    "imageUrl": "https://some_url.com/bg.jpg"
	}
},
Custom expression tiles
At portfolio (cmp.json) and application level (app.json), it is possible to define tiles with custom expressions. A custom expression is defined through a mathematical subset representation involving operations on criteria values (e.g. the ratio of number of lines of codes per critical violations or the count of applications with more than n files).
The tile can represent averaged values (excluding the application not having one of the values such as a background fact or some sizing measure, or those whose function calculation result is infinite) or a total value. For comparison, business criteria grades are average while sizing is usually a total on the portfolio.
Custom expression tiles can be defined for the current snapshot state (most recent snapshot for all applications at portfolio level or selected snapshots at application level), or via evolutions.


The mathematical formula available involve the following expression patterns:
Operators
Operator Name Syntax Associativity Example Result (, ) Parentheses (x) None 2 * (3 + 4) 14 , Parameter separator x, y Left to right max(2, 1, 5) 5 + Add x + y Left to right 4 + 5 9 - Subtract x - y Left to right 7 - 3 4 * Multiply x * y Left to right 2 * 3 6 / Divide x / y Left to right 6 / 2 3 %, mod Modulus x % y Left to right 8 % 3 2 ^ Power x ^ y Right to left 2 ^ 3 8 ! Factorial y! Left to right 5! 120 ? : Conditional expression x ? y : z Right to left 15 > 100 ? 1 : -1 -1 Functions
Function Name Syntax Associativity Example Result abs Absolute abs(x) None abs(-2) 2 round Round round(x,n) None round(3.142265,3) 3.142 sqrt Square root sqrt(x) None sqrt(4) 2 log Logarithmic log(x,base) None log(1024,2) log(1024) 10 3.01 InfoOther classic patterns are available but may not be supported by the Health Dashboard in terms of rendering (i.e. those returning non numerical values such as booleans).
CustomExpressionsEvolution
The custom expression tile enables operations on various multiple indicators in a single tile through snapshots. Lots of different operations can be performed on the tile, from scaling to combinations using mathematical formula (as listed above). As it could involve multiple results and extra operations to get the results, the CustomExpressionsEvolution tiles could hinder the performances of the dashboard at some point (depending on number of tiles, number of variables, number of snapshots).
Standard parameters
- title please note that exceptionally, the title is used to identify different types of custom expression tiles, from result to evolution, portfolio to application level. if you want to avoid duplicates at application level detail, please make sure tiles with the same formula have the same title field.
- description
- format
Tile specific parameters
- documentationa documentation information to explain about the custom indicator. The field value is a string (that can include html tags) that will be displayed on page details at portfolio level.
- aggregatorthe aggregation type: “average” or “sum”, default to average.
- expression the mathematical operation to perform for each application (some examples: “sqrt((tqi-1)/3)”, “tqi/loc”, “log(x)*y^2”, etc.)
- variables each variable defined in the mathematical operation has to be defined for results to be calculated. The variable name is defined through its key and has a type and an id - you can find a list of supported variables in the attached Excel spreadsheet. An example:
variables":{ "tqi":{"type":"qualityIndicator", "id":"TQI"}, "loc":{"type":"sizingMeasure", "id":"LINES_OF_CODE"}, "effort":{"type":"backgroundFact", "id":"EFFORT"} }InfoNotes about the aggregator type “AvgSum”
When using this aggregator type, a new property “aggregator” can also be provided for each key under “variables” to specify the aggregation type as “sum” or “average” for each variable respectively. The default is set to “sum” when “AvgSum” is defined under “aggregator”. For example the following lines under “variables” would take both factors produce a sum and then divide them. As such it is now possible to specify the addition of all the violations first, then add up all the function points, THEN do the division (the SUM(Violations) / SUM(Function points) ):
{
    "id":987654321529,
    "plugin": "CustomExpressions",
    "color": "green",
    "parameters": {
    	"title": "TQI - Critical violations ratio",
    	"aggregator": "AvgSum",
    	"description":"",
    	"format":"0.00",
    	"expression":"crit / tqi",
    	"variables":{
        "tqi": {"type":"qualityIndicator", "id":"TQI", "aggregator": "sum"},
        "crit":{"type":"sizingMeasure", "id":"CRITICAL_VIOLATIONS", "aggregator": "sum"}
    	}
    }
},
Example (for cmp.json) - CustomExpressions
{
    "id": 987654321529,
    "plugin": "CustomExpressions",
    "color": "blue",
    "parameters": {
    "title": "TQI - Critical violations ratio",
    "description":"",
    "format":"0.00",
    "expression":"crit / tqi",
    "variables":{
        "tqi": {"type":"qualityIndicator", "id":"TQI"},
        "crit":{"type":"sizingMeasure", "id":"CRITICAL_VIOLATIONS"}
    }
    }
},
Example (for app.json) - CustomExpression
{ "id": 987654321529, "plugin": "CustomExpression", "color": "blue", "parameters": { "title": "TQI - Critical violations ratio", "description":"", "format":"0.00", "expression":"crit / tqi", "variables":{ "tqi": {"type":"qualityIndicator", "id":"TQI"}, "crit":{"type":"sizingMeasure", "id":"CRITICAL_VIOLATIONS"} } } },- **mode:**the mode in which the value needs to be displayed: