This page will help you solve problems related to Performance issues that occurs during the processing of source files.
During this step, the analyzer parses the files and allocate the parse results in memory.

Release | Yes/No |
|---|---|
| 8.3.x |
RDBMS | Yes/No |
|---|---|
| CSS |
Step by Step scenario
1- Package and deliver the source code.
2- Set as current version the application.
3- Run the analysis. Use debug mode if possible as in many cases this may provide additional information.
4- Open the log file, the parsing step is very long between two lines or does not advance.
Action Plan
During the Processing of the source Files, the analyzer is loading the source code in memory, and we may face some performance issue during this step.
1- Check the log files
1-1- Delta between two parsing files line
Check if there are time jump between two lines as shown below. In that case, go to the point 2- Check the source files, 3- Check the Deployment folder location and 4- Check the CPU usage.

1-2- Warnings Messages and log file size
Check the number of warning related to unresolved objects or unreferenced files. If all the parsing files line have these warning message, then depending of the number of files to be parsed, the log file can grow up quickly and the analyzer will take more time to update the log file. In that case, you must resolve these un-referenced files and the analysis configuration.
For .Net technology please refer this page : Tools - DotNET - DotNET analysis checklist for troubleshooting any crashes
2- Check the source files
2-1- Remove the 0 kb source files
Check if there are some source files having size equal to 0 kb. If so remove them
2-2- Check the biggest files
During the parsing step, the analyzer copy in memory the files. Some files may be too big and this can take time to be copied in to memory. In case file size is bigger than few Mega bytes (5 or 10 MB), check if this is a generated file. If so, check if these generated files are useful for other source file (dependencies or references), if not, you can remove them from the source file.
In case of Web files (HTML, XML files), check if the files contain data, or are useful for analysis.
2-3- Check for any CR/LF sequence present in the source files
During the parsing step,these embedded CR or LF sequences are misleading, when the analyzer encounters these sequences, it thinks that a new line is beginning (which is not the case). So this affect analysis run time and leads to the performance issue.
How to find the sequence: Open the file in notepad++ and use the 'extended' search mode and look for \r\n. That does find all your CRLF.
For example:
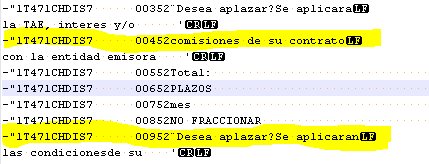
So, the solution to overcome this issue is to remove these sequence from the source file before doing the analysis.
How to remove the sequence: Open the file in notepad++ and replace all the \r\n with blank.
We have seen this issue for .Net and Mainframe analysis.
2-3- Check for the SQ/IX (Sequence/Index) files reference in the DatabaseExtraction.uaxdirectory
If you have around millions of SQ/IX files (.uax and src) referred in the .uaxdirectory file this causes the performance issue in the SQL Analyzer.
So, you can comment all the SQ/IX files (.uax and src) referred in the .uaxdirectory file and run the analysis, suppressing the SQ/IX files would have no impact on the analysis result. The impact is null for transactions, and restricted to some quality rules/metrics (e.g., fan out of some procedures, statements, etc...)
This issue is fixed in CAST 8.2.0
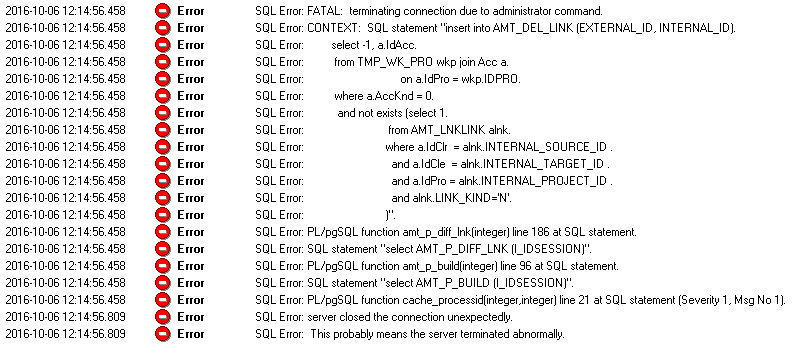
3- Analysis stuck at "Ending External Link processing"
- Analysis stuck and you do not have any clue in the analysis log and you want more SQL traces generated, you have to stop the procedure causing the issue.
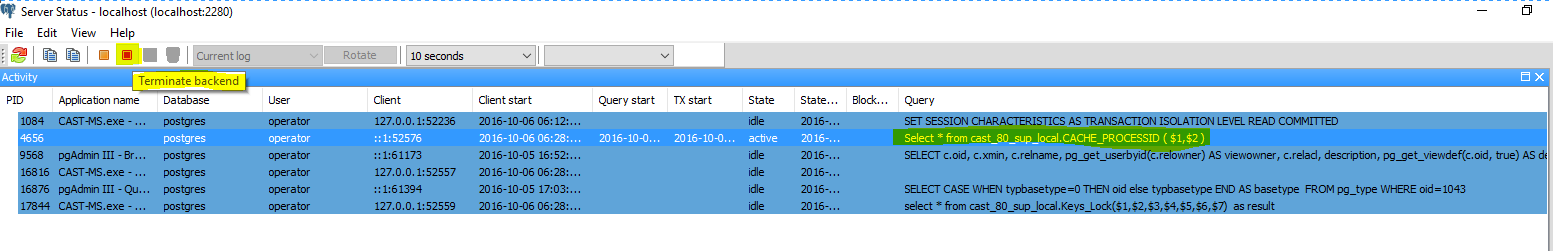
- Go to PGAdmin then select server status.
- There you can see all the queries with their duration, the queries that have been active for a long time would be in orange color.
- When CACHE_PROCESSID gets orange (be careful that it is yours : you can check it with the IP of the client, which should be your analysis server). Stop it with the red button It should generate details on what sub-procedure was being executed in the analysis log file.

- Attached the workaround script to apply on your local base.
- It modifies a Stored Procedure to avoid unnecessary time-consuming processing.
This issue has been fixed in CAST 8.0.4
4- Check the Deployment folder location
During the parsing file, the analyzer copy the source file from the deployment folder to the memory. If the Deployment folder is located on drive that maps a server or distant machine, make sure that the flow is fast. To do that, copy a small file on your local machine and check how long it takes to be copied. If it is longer than expected, you have to change the Deployment folder location on to a faster drive.
5- Check the Machine Performance
Open the Task manager:
1- Check the memory consumption for the AnaRun, Jeecmd, or dotnetcmd process (depends on what is being run). If the memory consumption is 4 GB, and there is only 8 GB is the machine, this can explain the performance issue.
2- Check if the CPU usage has reached 100%. If yes, it means that other processes are currently running and consuming many resources. You have to stop the unnecessary processes.

6- Technology application is Mainframe
The mainframe analyzer can be affected by problem files.
These files may have been extracted improperly from the mainframe or were not properly formed on the mainframe.
6-1- Preanalysis Step
Checks and remediations you can do on the source code prior to analysis are:
- Check and remove any 0 byte files from the analysis
- Check and remove any files greater than 1 MB from the analysis.
- CAST 7.3 (and below) is a 32-bit process so analyzing any very large files can lead to out of memory situations as CAST is trying to not only put this file, but any associated copybook files into memory.
- Very large files can correspond to a large amount of links and objects which can exceed memory.
- Generated files which may not be in a format suitable for analysis are often very large in size.
- You can start with removing them and then add key ones if you need to try to get some of them into the analysis.
- If possible, check for any files which might have binary zeros at the end of them. These files are ones which most likely had problems with the extraction from the mainframe environment.
6-2- Post analysis action
After an analysis hang or crash, you can check the following:
- Perform the pre-analysis remediations on the source code if you have not done them yet
- Check the analyzer log to see the last file that was analyzed and remove that from the analysis to see if it may now succeed without it.
- You can also identify problem files by dichotomy. This can potentially be time consuming depending on the size of your source code.
- Split the analyzed files into smaller groups and analyze those groups
- Proper splitting techniques can be found in the CAST documentation. For the 7.3. release, this can be found in the CAST AIP 7.3.x Documentation > CAST AIP 7.3.x Documentation > Cookbooks > Application Analysis and Measurement with CAST AIP > 1. Application qualification and version delivery > 1.3. Application Qualification > Mainframe - application qualification specifics section which is in the 'Application Qualification and Version Delivery' section.
6-3- If Pre and Post analysis do not resolve the issue
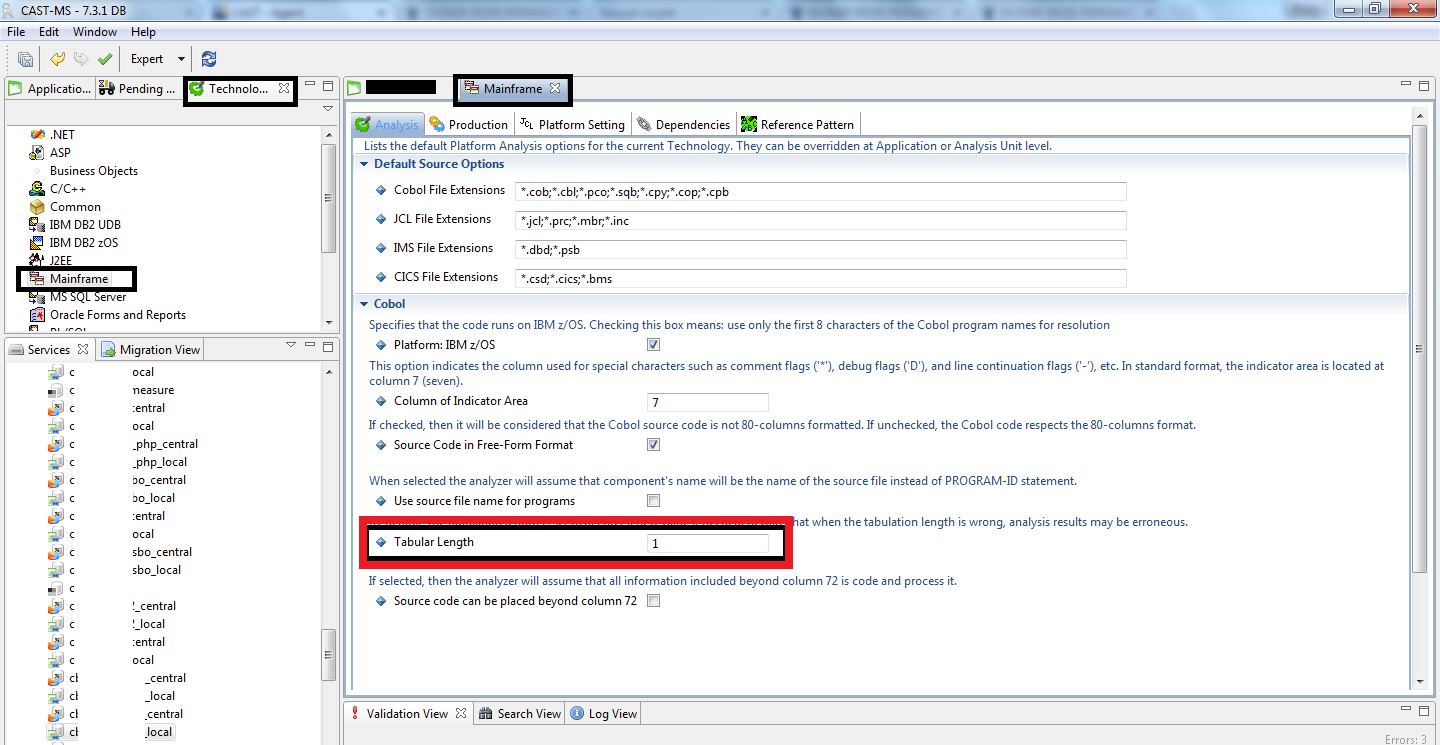
By default, in the Mainframe analyzer, the tabulation length is equal to 8 characters.
If in one source file, the tabulation length is not 8 and if you did not change the tabulation length parameter in Cast MS, then the analysis will never end.

Solution:
In CAST-MS, you have to be in Expert Mode. Go to the technology page, select the Mainframe technology, set the option 'Tabulation Length' to the correct value (for instance 1 for the above example) as it is shown in the screenshot below:
6- Technology application is ABAP
Check if you have used the subcode option when performing the SAP extraction with the SAP Extractor version 8.0.2 or lower. With this option, there is some incomplete information that is extracted that then cannot be properly leveraged by the analyzer. This option can cause the analyzer to run for a very long time and possibly never complete. You will also see a large amount of "Unresolved Method" messages in the analysis log. If the analysis log is on a network drive, this can cause even more problems as the logfile may grow to be several gigabytes in some cases. This problem is fixed in SAP Extractor version 8.0.3 or above.
Check in the CAST-MS if you have "Number of Instances" set to 200000, see below screen shot:

Change the "Number of Instances" from "200000" to "1100000", save the settings and run the analysis.
Performance issue while processing of ZBW_HANA_CHECKLIST.abap has been fixed in 8.1.6 and higher version, so as a workaround remove this file from analysis or upgrade CAST version to 8.1.6 or higher version if you are using lower version of CAST.
7- If the log file is not complete

Rerun the analysis in debug mode if it hasn't been turned on
Turn on debug mode as for there may be more information with that mode. ASP/.NET technology definitely logs messages that may provide assistance only in debug mode.
Check in the AMT Traces the passivation
As screenshot below, in the AMT traces, you can see the memory consumption, and in case of performance issue, you can check if there is passivation process as below. This process lead to performance issue and is due to memory leak.

In that case, solution is to increase the virtual memory by :
- Increase the Memory to 3GB in a 32 bits machine
- Use the CAST AIP 8.0.x that is a 64 bits version
If it is not passivation issue
The issue may be due to a (or some) file(s). To identify the file, investigate by dychotomy : Identify the type of file (first xml files, second html files, properties file, jsp files, then java files).
Once you identify the file(s), remove/exclude it from the analysis.
8- Technology application is Shell :
If your technology is Shell then please check SHELL Analysis job is getting stuck for other languages
SHELL Analysis job is getting stuck
If the SHELL Analysis Job, which is done by the Universal Analyzer is getting stuck and the analysis log for SHELL Analysis unit is not getting updated after a particular file processing step as shown in the below screenshots:
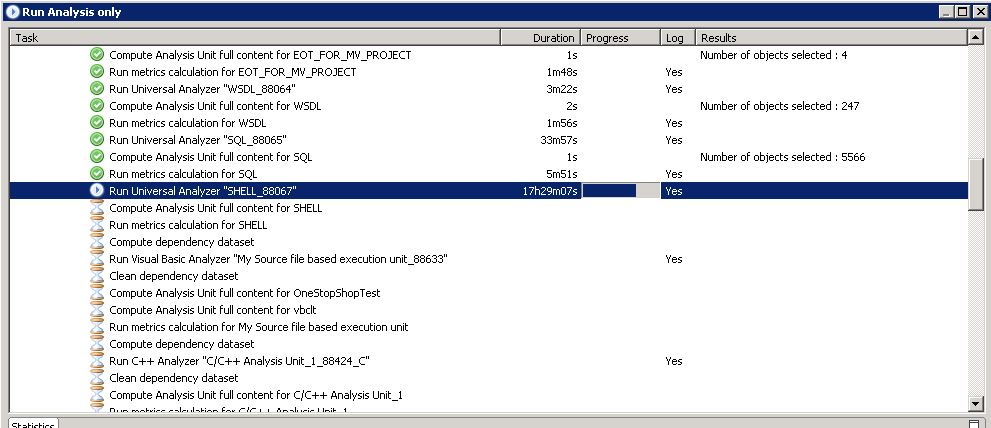
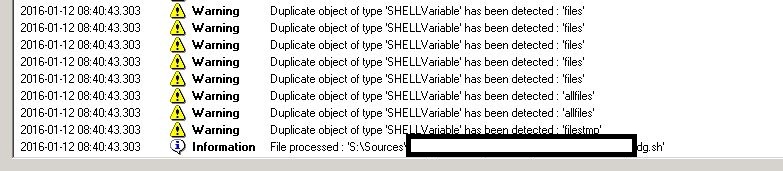
Then please perform the following steps:
- Try to find out if there are any non-shell files (like XML files) that are just renamed to "filename.xml.ksh" present in the source code. Here the file type is XML but the extension is of SHELL (.ksh). If they are present in the source code then exclude all of them as they are XML files and the pre-processing will not be done.
- In the log, try to identify if there are any warnings for .csh files. Check if they are required in the analysis, i.e., the content in them is valid shell source code. The warning here for .csh files means: "Syntax not recognized for <filename>.csh" or "can not resolve <object name>".
- Clear out any junk files that are present in the source code and which are not required in the current analysis. Junk file is any file which is in the source code, but when that file is opened there are garbage characters in them. These files cannot be processed by the pre-processor and thus should be removed/excluded from the analysis. The way to identify a junk file is: Open the analysis log (when the analysis seems stuck) and check if analyzer is not able to process a specific file. If this is the case, then go to the deploy folder and open that file. Check if there are garbage characters in them. If there are then, this file should be removed from source code or excluded from analysis.
After performing the above steps, the SHELL Analysis job will execute without any performance issue.
If your issue is still not resolved then go to step 7 Check the source files
For CAST Technical Support only - Please follow the steps given under page - CMS Snapshot Analysis - Run Analyzer - Information - How to reproduce user issues for Extension
Error Free logs - CMS Snapshot Analysis - Run Universal Analyzer - Shell - Error Free Logs - CAST AIP 83
9- Analysis stuck at "Starting External Link processing" and technology is HTML5
- If you have any custom dependencies that were defined with HTML5 and other analysis units, stop the analysis if it is not stopped already and remove the custom HTML5 dependencies with other analysis units. Once they are removed, then restart the analysis to confirm that the issue is resolved.
- See and expand the documentation on this issue here:.NET - ASP.NET MVC Razor support
- For assistance with adding or removing dependencies, please see the documentation here: CMS - Dependencies tab (rules)
- If your issue is still not resolved or you do not have any dependencies defined with HTML5, then go to step 7 Check the source files